9. 2020 Cold Air Damming
Cold air damming (CAD) occurs when the cold dense air is topographically trapped along the leeward side of the mountain. CAD has been a forecast challenge in GFS. This case is an example illustrating the GFS’s capability of handling cold air damming east of the Appalachian mountains.
9.1. Model Configuration and Datasets
The case runs are initialized at 12z Feb 03, 2020 with 120 hours forecasting. The corresponding namelist options that need to be changed are listed below. The app uses ./xmlchange to change the runtime settings. The settings that need to be modified to set up the start date, start time, and run time are listed below.
./xmlchange RUN_STARTDATE=2020-02-03,START_TOD=43200,STOP_OPTION=nhours,STOP_N=120
Initial condition (IC) files are created from GFS operational dataset in NEMSIO format. The GFS reanalysis dataset are used as ‘truth’ to compare with simulation results.
The GFS model EMC global workflow points to the most up-to-date GFS model development code. The GFS.v16.0.10 is tested in C768 (~13km) resolution and in 128 vertical levels. It uses two scripts, setup_expt_fcstonly.py and setup_workflow_fcstonly.py to set up the mode simulation date and case directories.
The case runs are initialized at 12z Feb 03, 2020 with 120 hours forecasting. The settings that need to be modified to set up the start date and directories are listed below.
./setup_expt_fcstonly.py --pslot 2020CAD --configdir /PATH/TO/YOUR/GLOBAL/WORKFLOW/parm/config --idate 2020020312 --edate 2020020312 --res 768 --comrot /PATH/TO/YOUR/EXP/DIR/comrot --expdir /PATH/TO/YOUR/EXP/OUTPUT/expdir
The account and simulation duration time can be set up in /expdir/2020CAD/config.base file.
./setup_workflow_fcstonly.py --expdir /PATH/TO/YOUR/OUTPUT/expdir/2020CAD
Next step is to go to /expdir/2020CAD to submit the run by
crontab 2020CAD.crontab
9.2. Case Results
9.2.1. Synoptic Dynamics
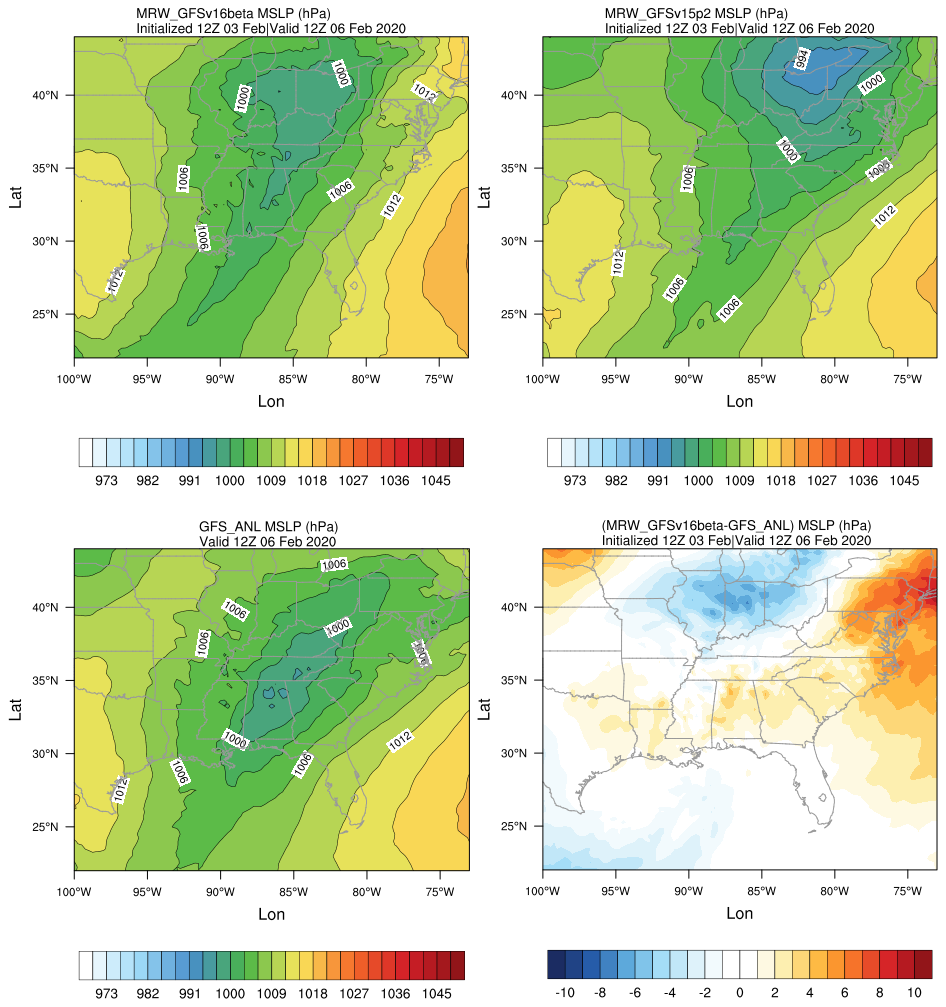
Mean sea level pressure (hPa)
MRW_GFSv16beta more correctly forecasts the surface low than MRW_GFSv15p2.
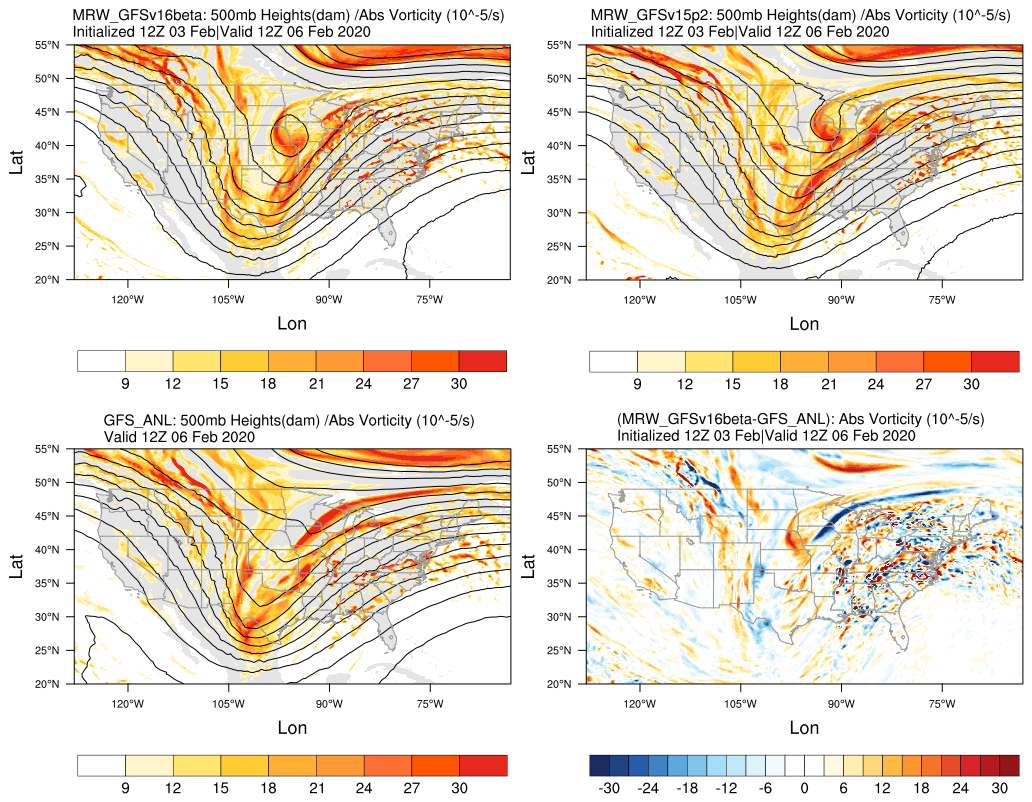
500 hPa geopotential heights (dam) and absolute vorticity (10 -5/s)
A suspicious upper-level cut-off low is simulated in MRW_GFSv16beta.
Both MRW_GFSv16beta and MRW_GFSv15p2 simulate a positively tilted trough, same as GFS_ANL.
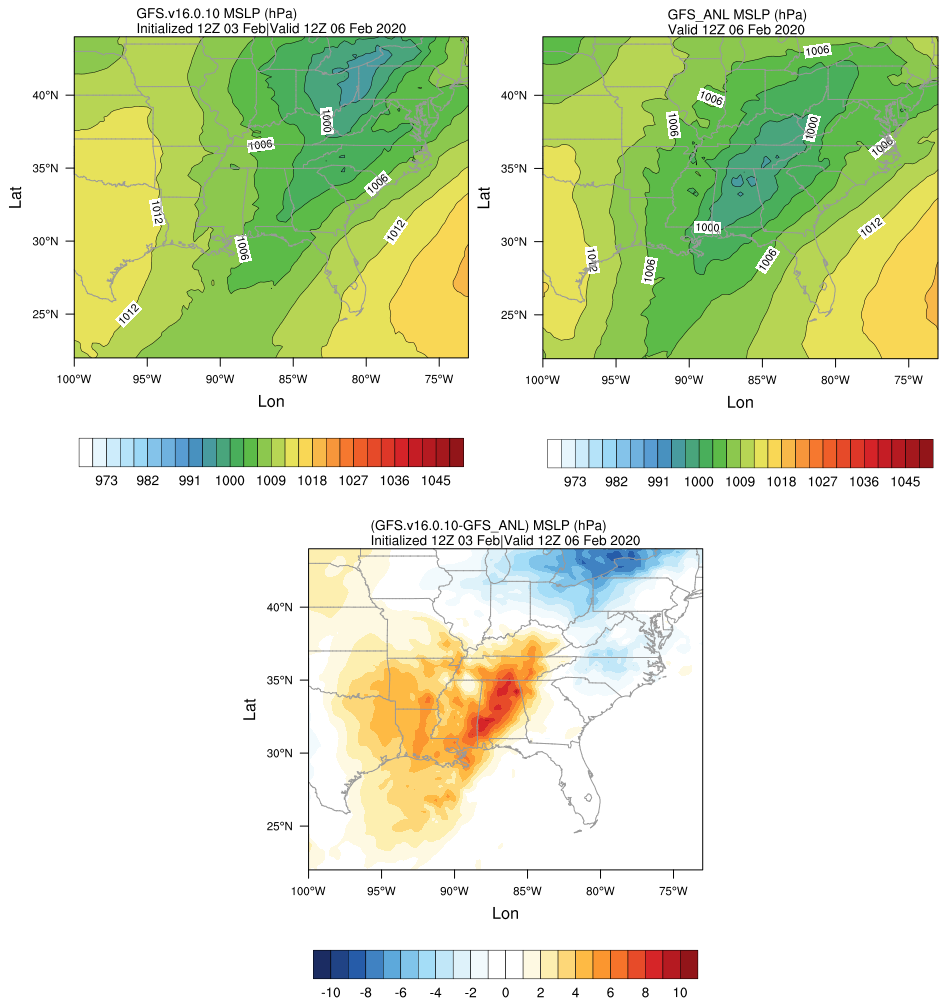
Mean sea level pressure (hPa)
GFS.v16.0.10 correctly captures the strength of the surface low, but the location is shifted northeastwards.
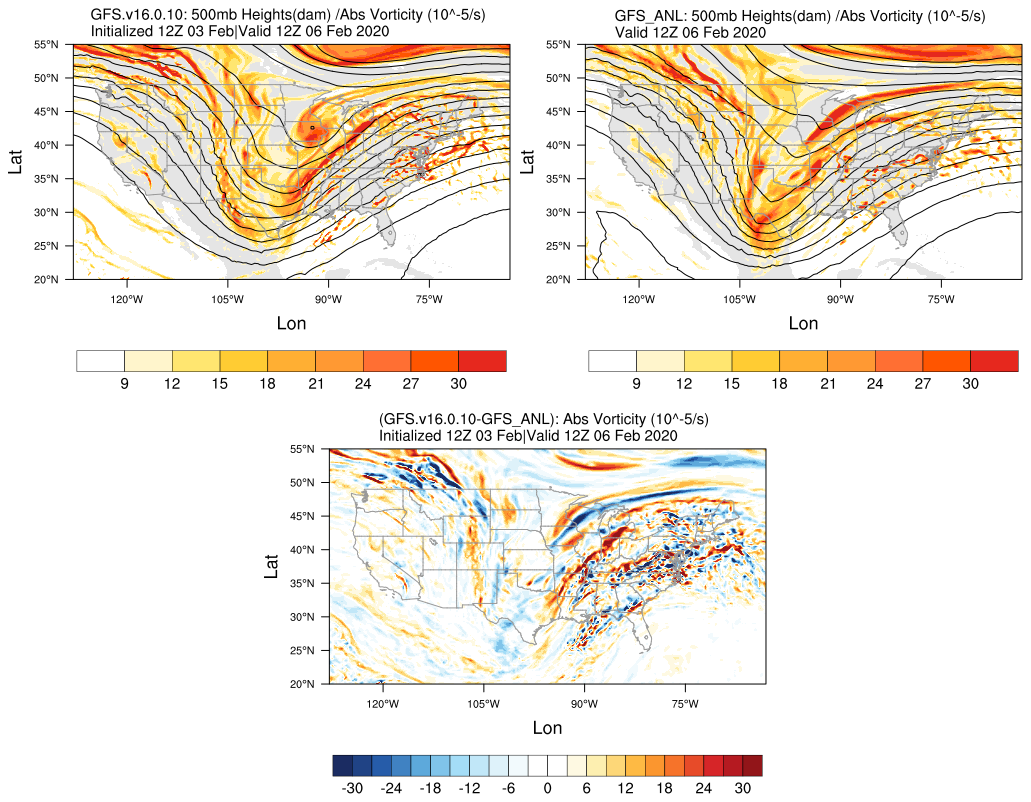
500 hPa geopotential heights (dam) and absolute vorticity (10 -5/s)
GFS.v16.0.10 shows a tendency of the positively tilted trough at 500 hPa, which is consistent with GFS_ANL.
9.2.2. Surface Temperature and Wind Speed
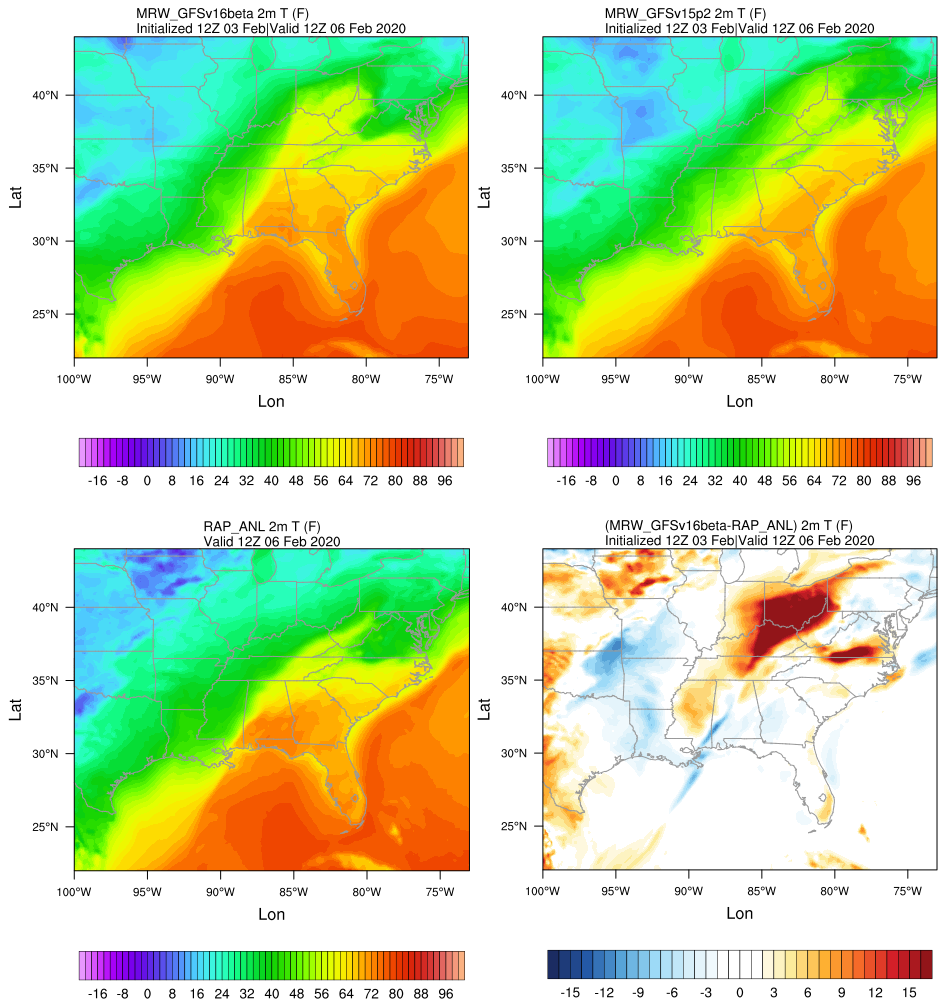
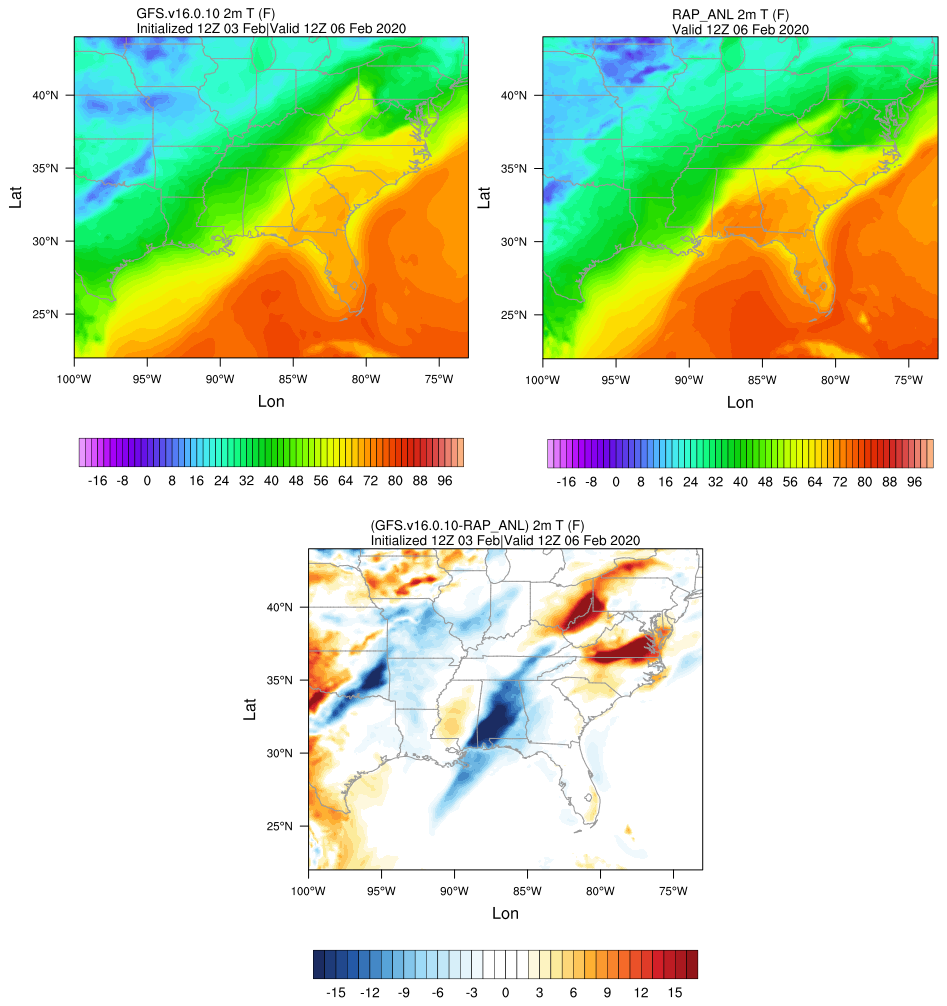
2-m temperature (F)
Cold air was dammed up along the Appalachian mountains in RAP_ANL.
Both MRW_GFSv16beta and MRW_GFSv15p2 generates warm bias along the east side of Appalachian.
Specifically, MRW_GFSv16beta simulates warmer temperatures over Ohio.
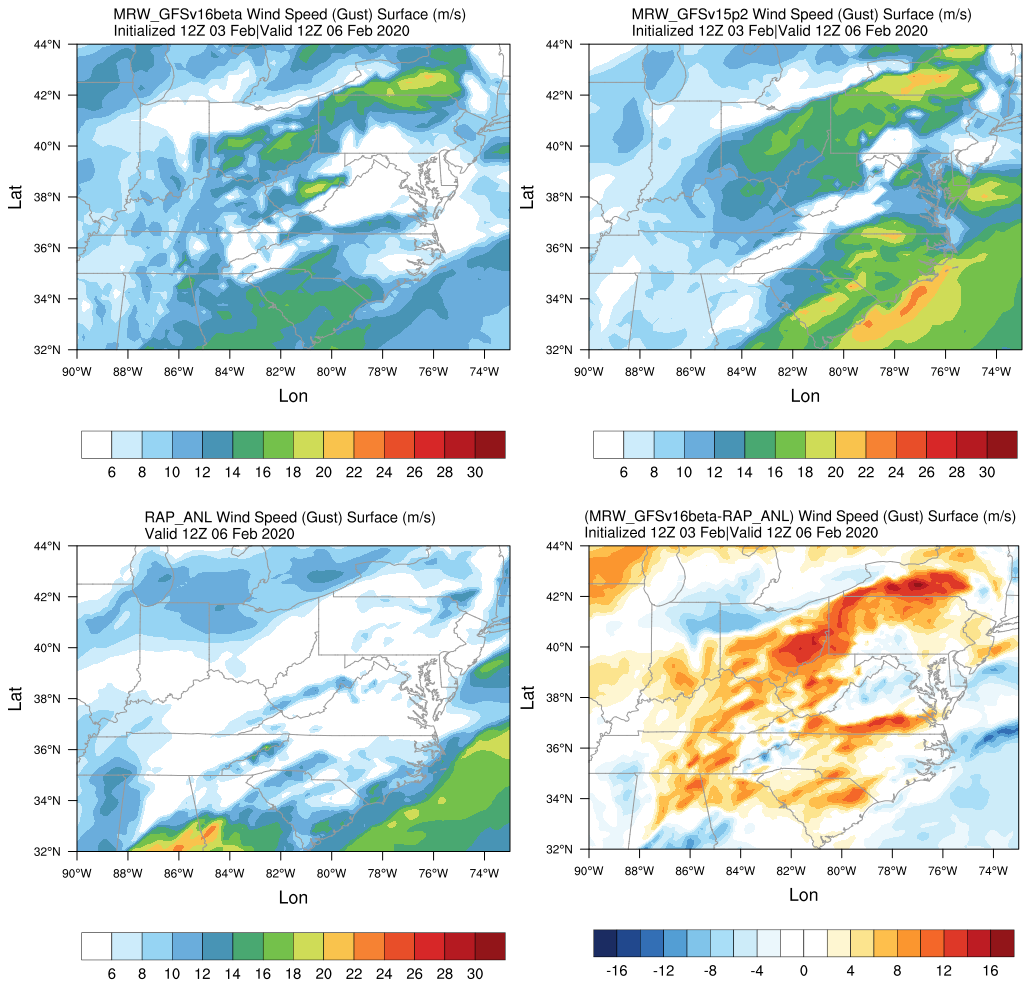
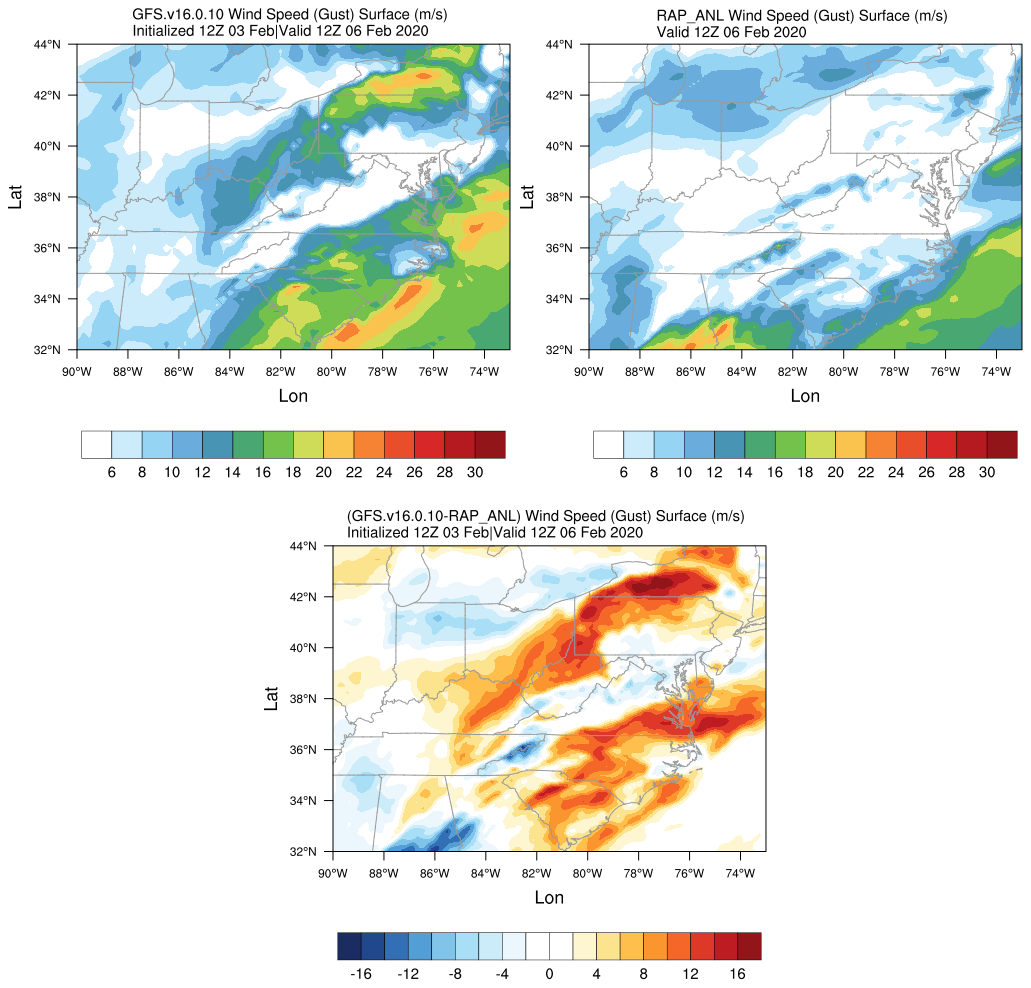
Surface gust (m/s)
Stronger surface winds are simulated by MRW_GFSv16beta and MRW_GFSv15p2.
9.3. Summary and Discussion
GFSv.16.0.10 shows improvements in handling the shallow cold air mass during CAD events compared with its prior versions (MRW_GFSv16beta and MRW_GFSv15p2). But the warm bias still exists. This could lead to weaker temperature inversions with the warmer low-level temperatures at sites along the east side of Appalachian.