4. 2019 Hurricane Lorenzo
Hurricane Lorenzo was a category 5 hurricane and the second deadliest hurricane in 2019. The initial peak intensity of 125 kt occurred at around 0000 UTC on 27 September. Meanwhile, the hurricane slowed and turned northwestward in response to a break that developed within the subtropical ridge at the Atlantic Ocean (Zelinsky 2019).
4.1. Model Configuration and Datasets
The case runs are initialized at 12z Sep 25, 2019 with 120 hours forecasting. The app uses ./xmlchange to change the runtime settings. The settings that need to be modified to set up the start date, start time, and run time are listed below.
./xmlchange RUN_STARTDATE=2019-09-25,START_TOD=43200,STOP_OPTION=nhours,STOP_N=120
Initial condition (IC) files are created from GFS operational dataset in NEMSIO format. The Stand-alone Geophysical Fluid Dynamics Laboratory (GFDL) Vortex Tracker is a tool to estimate hurricane tracks and intensities. The Best Track dataset provides the ‘truth’ data for hurricane evolution.
The GFS model EMC global workflow points to the most up-to-date GFS model development code. The GFS.v16.0.10 is tested in C768 (~13km) resolution and in 128 vertical levels. It uses two scripts, setup_expt_fcstonly.py and setup_workflow_fcstonly.py to set up the mode simulation date and case directories.
The case runs are initialized at 12z Sep 25, 2019 with 120 hours forecasting. The settings that need to be modified to set up the start date and directories are listed below.
./setup_expt_fcstonly.py --pslot Lorenzo --configdir /PATH/TO/YOUR/GLOBAL/WORKFLOW/parm/config --idate 2019092512 --edate 2019092512 --res 768 --comrot /PATH/TO/YOUR/EXP/DIR/comrot --expdir /PATH/TO/YOUR/EXP/OUTPUT/expdir
The account and simulation duration time can be set up in /expdir/Lorenzo/config.base file.
./setup_workflow_fcstonly.py --expdir /PATH/TO/YOUR/OUTPUT/expdir/Lorenzo
Next step is to go to /expdir/Lorenzo to submit the run by
crontab Lorenzo.crontab
4.2. Case Results
4.2.1. Hurricane Track and Intensity
Hurricane tracks from MRW_GFSv16beta (blue line), MRW_GFSv15p2 (red line), and Best Track (black line). The dots are color-coded with the vortex maximum 10-m wind speed (WS, kt).
MRW_GFSv16beta and MRW_GFSv15p2 generate right-of-track bias. Hurricane track from MRW_GFSv16beta is closer to the Best Track compared with MRW_GFSv16beta.
MRW_GFSv16beta and MRW_GFSv15p2 do not capture the hurricane intensities (represented by max WS).
Time series of the vortex maximum surface wind speed (WS, left panel) and minimum mean sea level pressure (MSLP, right panel)
The maximum surface wind speed at the vortex center in MRW_GFSv15p2 is larger than MRW_GFSv16beta. However, both two physics compsets do not reach the peak intensity identified in Best Track data.
The minimum sea level pressures from MRW_GFSv15p2 and MRW_GFSv16beta are both larger than Best Track data.
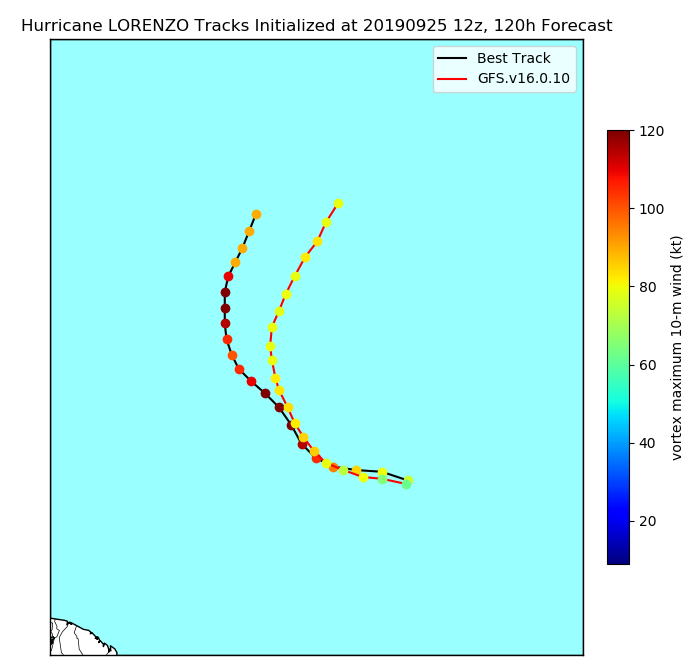
Hurricane tracks from GFS.v16.0.10 (blue line) and Best Track (black line). The dots are color-coded with the vortex maximum 10-m wind speed (WS, kt).
GFS.v16.0.10 generates right-of-track bias.
Time series of the vortex maximum surface wind speed (WS, left panel) and minimum mean sea level pressure (MSLP, right panel)
The maximum surface wind speed at the vortex center in GFS.v16.0.10 is lower than Best Track data.
The minimum sea level pressure from GFS.v16.0.10 is larger than the Best Track data.
4.2.2. N. Atl. Subtropical High
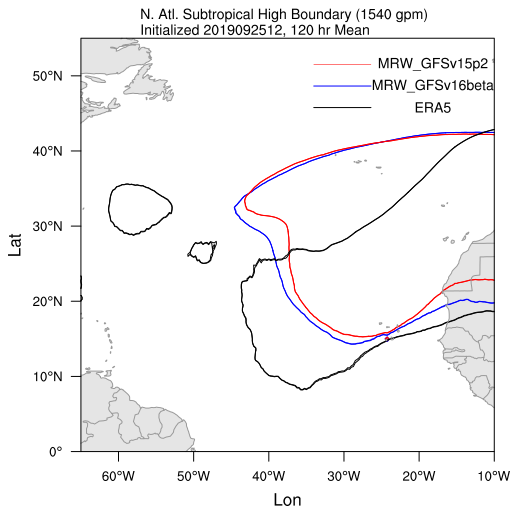
North Atlantic (N. Atl.) Subtropical high boundary (1540 gpm at 850 hPa) from MRW_GFSv16beta (blue line), MRW_GFSv15p2 (red line), and ECMWF Reanalysis v5 (ERA5) (black line).
The subtropical ridges simulated from MRW_GFSv16beta and MRW_GFSv15p2 are located east of the one in ECMWF Reanalysis v5 (ERA5).
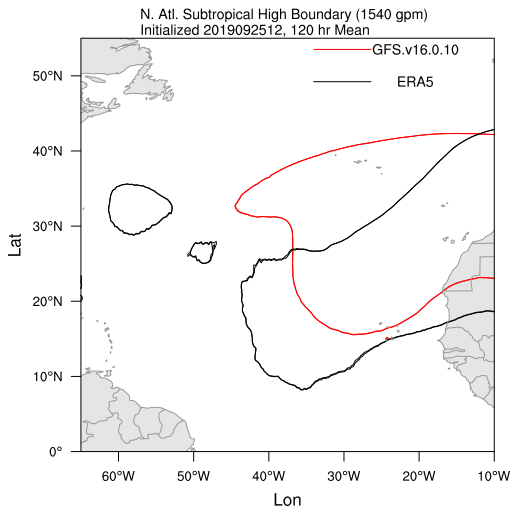
North Atlantic Subtropical high boundary (1540 gpm at 850 hPa) from GFS.v16.0.10 (red line) and ECMWF Reanalysis v5 (ERA5) (black line).
GFS.v16.0.10 generates a subtropical ridge east of the one in ECMWF Reanalysis v5 (ERA5).
4.3. Summary and Discussion
The physics compset of GFS.v16beta shows improvements in simulating the tracks of hurricane Lorenzo compared with MRW_GFSv15p2. This is related to its better handling of the subtropical high location over the N. Atl. Ocean. However, the MRW_GFSv16beta does not show improvements in capturing the maximum wind speed and minimum surface pressure at the vortex center. In GFS.v.16.10, the right-of-track bias of hurricane Lorenzo over the N. Atl. Ocean still exists. The misrepresentation of the position and/or strength of the subtropical ridge is a key element to explain Lorenzo’s early recurvature.
References
Zelinsky D A. (2019). National Hurricane Center Tropical Cyclone Report: Hurricane Lorenzo [J]. https://www.nhc.noaa.gov/data/tcr/AL132019_Lorenzo.pdf. [Link]