11. 2020 July CAPE Case
This case illustrates the low Convective Available Potential Energy (CAPE) issue during summertime in GFS.v16 identified by NOAA Environmental Modeling Center (EMC) Model Evaluation Group (MEG).
11.1. Model Configuration and Datasets
The case runs are initialized at 00z Jul 23, 2020 with a 24 hour forecast length. The corresponding namelist options that need to be changed are listed below. The app uses ./xmlchange to change the runtime settings. The settings that need to be modified to set up the start date, start time, and run time are listed below.
./xmlchange RUN_STARTDATE=2020-07-23,START_TOD=0,STOP_OPTION=nhours,STOP_N=24
Initial condition (IC) files are created from GFS operational dataset in NEMSIO format. The GFS reanalysis dataset is used as ‘truth’ to compare with simulated synoptic dynamic fields. The CAPE field is evaluated based on Rapid Refresh (RAP) analysis dataset and atmospheric sounding.
The GFS model EMC global workflow points to the most up-to-date GFS model development code. The GFS.v16.0.10 is tested in C768 (~13km) resolution and in 128 vertical levels. It uses two scripts, setup_expt_fcstonly.py and setup_workflow_fcstonly.py to set up the mode simulation date and case directories.
The case runs are initialized at 00z Jul 23, 2020 with a 24 hour forecast length. The settings that need to be modified to set up the start date and directories are listed below.
./setup_expt_fcstonly.py --pslot 2020CAPE --configdir /PATH/TO/YOUR/GLOBAL/WORKFLOW/parm/config --idate 2020072300 --edate 2020072300 --res 768 --comrot /PATH/TO/YOUR/EXP/DIR/comrot --expdir /PATH/TO/YOUR/EXP/OUTPUT/expdir
The account and simulation duration time can be set up in /expdir/2020CAPE/config.base file.
./setup_workflow_fcstonly.py --expdir /PATH/TO/YOUR/OUTPUT/expdir/2020CAPE
Next step is to go to /expdir/2020CAPE to submit the run by
crontab 2020CAPE.crontab
11.2. Case Results
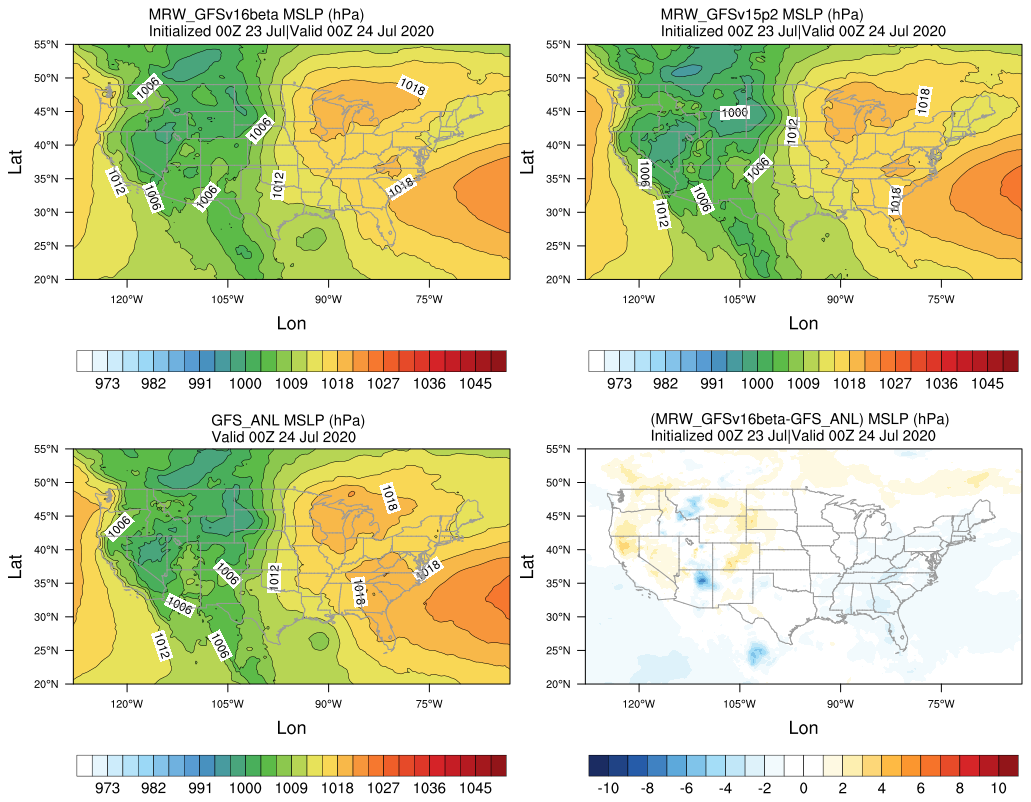
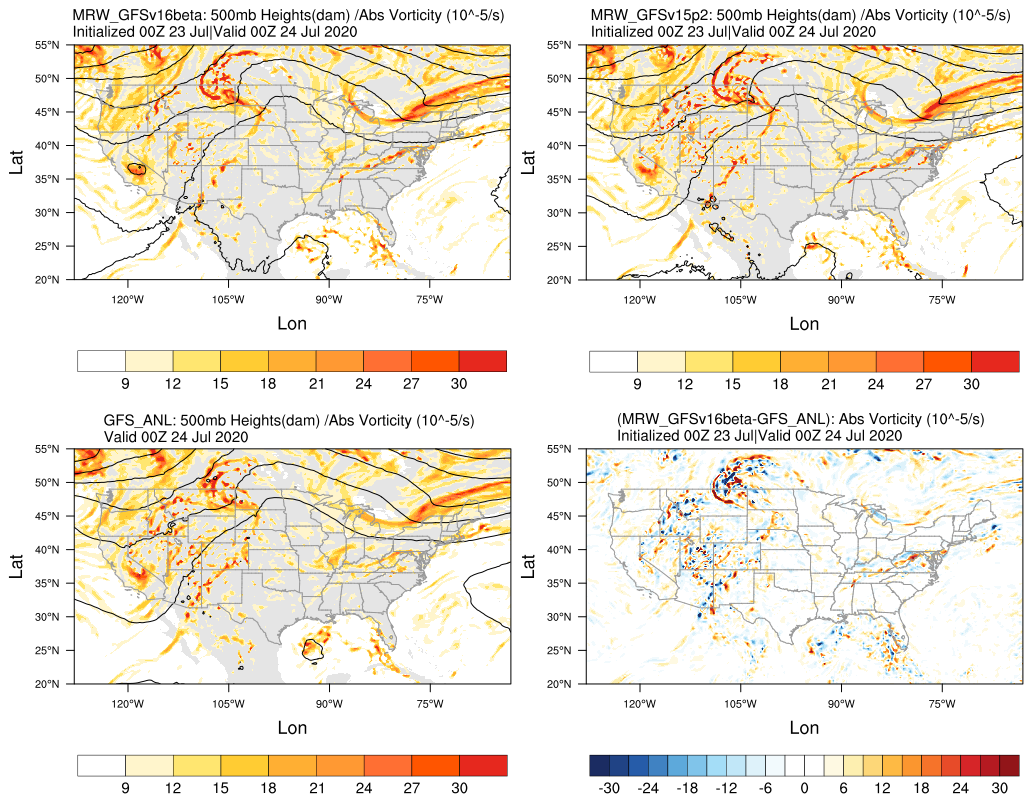
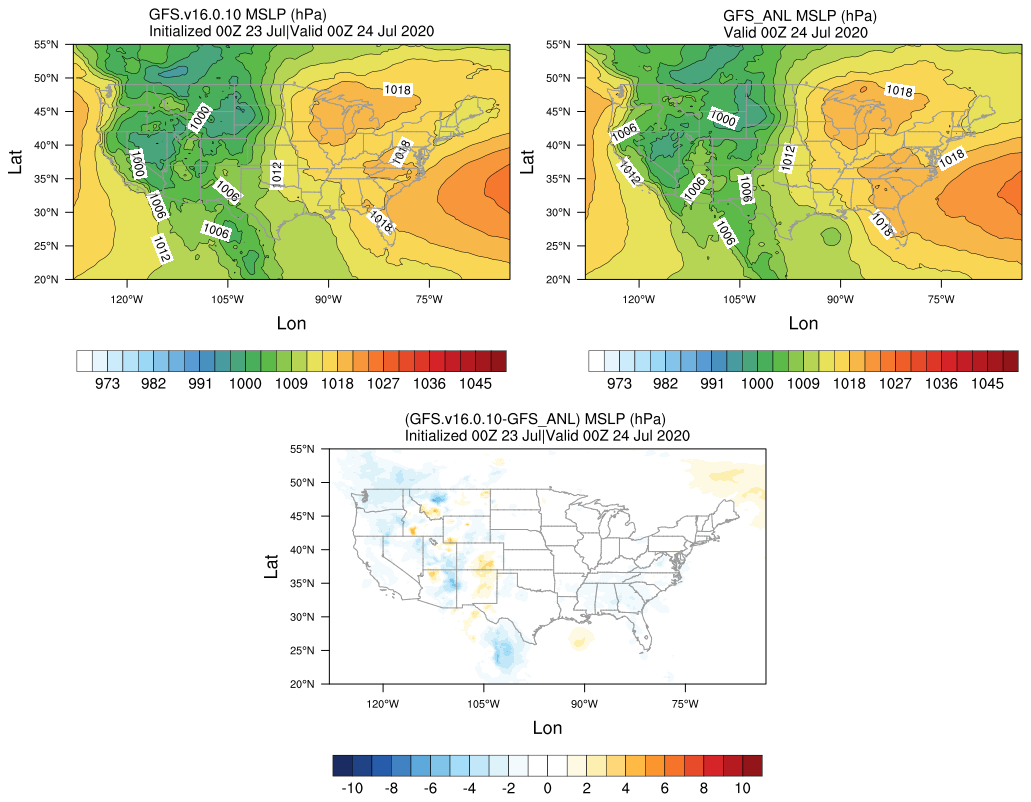
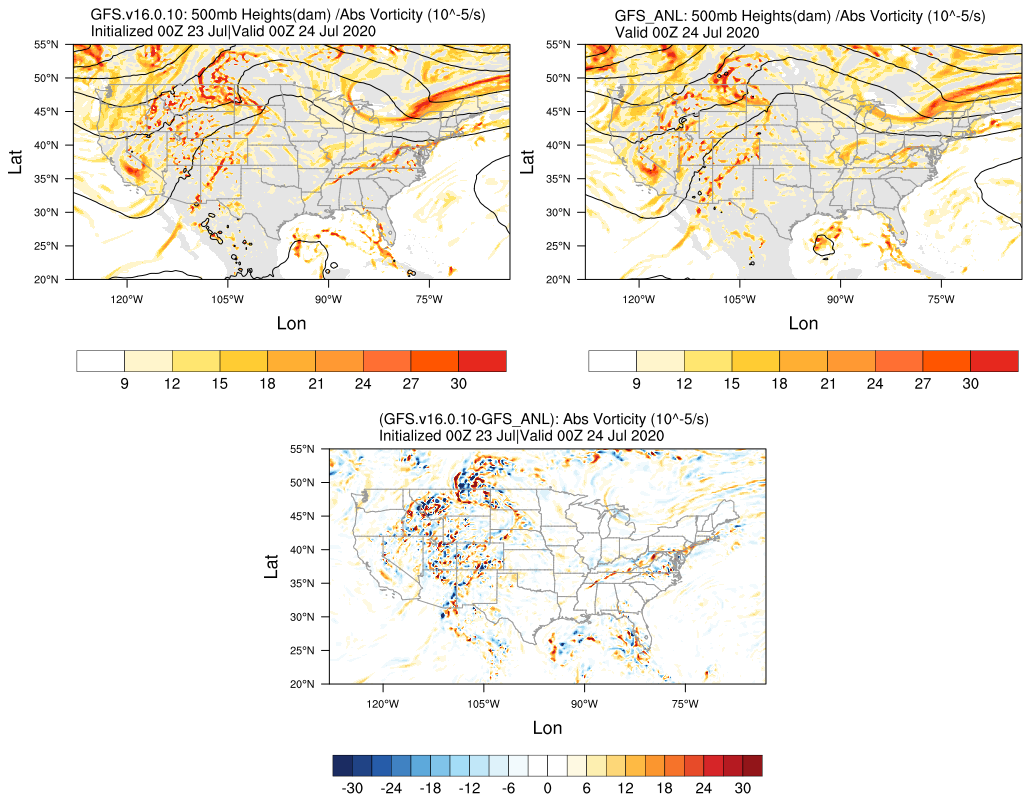
11.2.1. Synoptic Dynamics
11.2.2. Convective Available Potential Energy
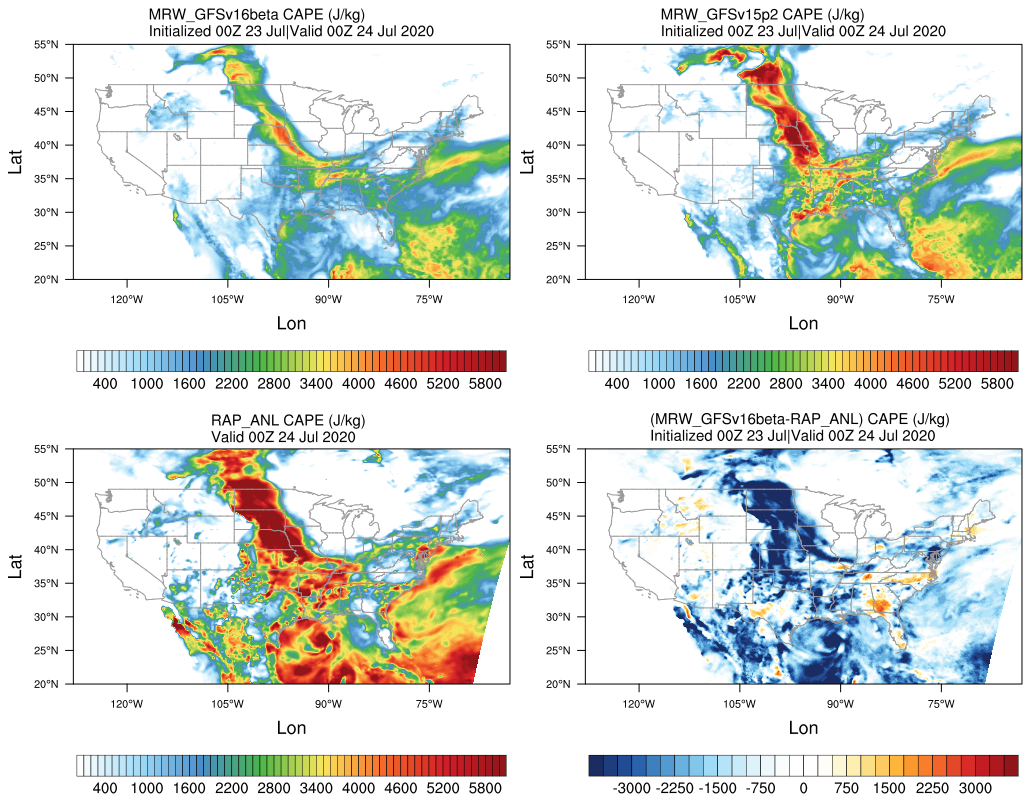
Spatial distribution of Convective Available Potential Energy (CAPE)
Both MRW_v15p2 and MRW_GFSv16beta underestimate the CAPE values compared with RAP_ANL.
The CAPE values simulated in MRW_v15p2 are correctly larger than MRW_GFSv16beta.
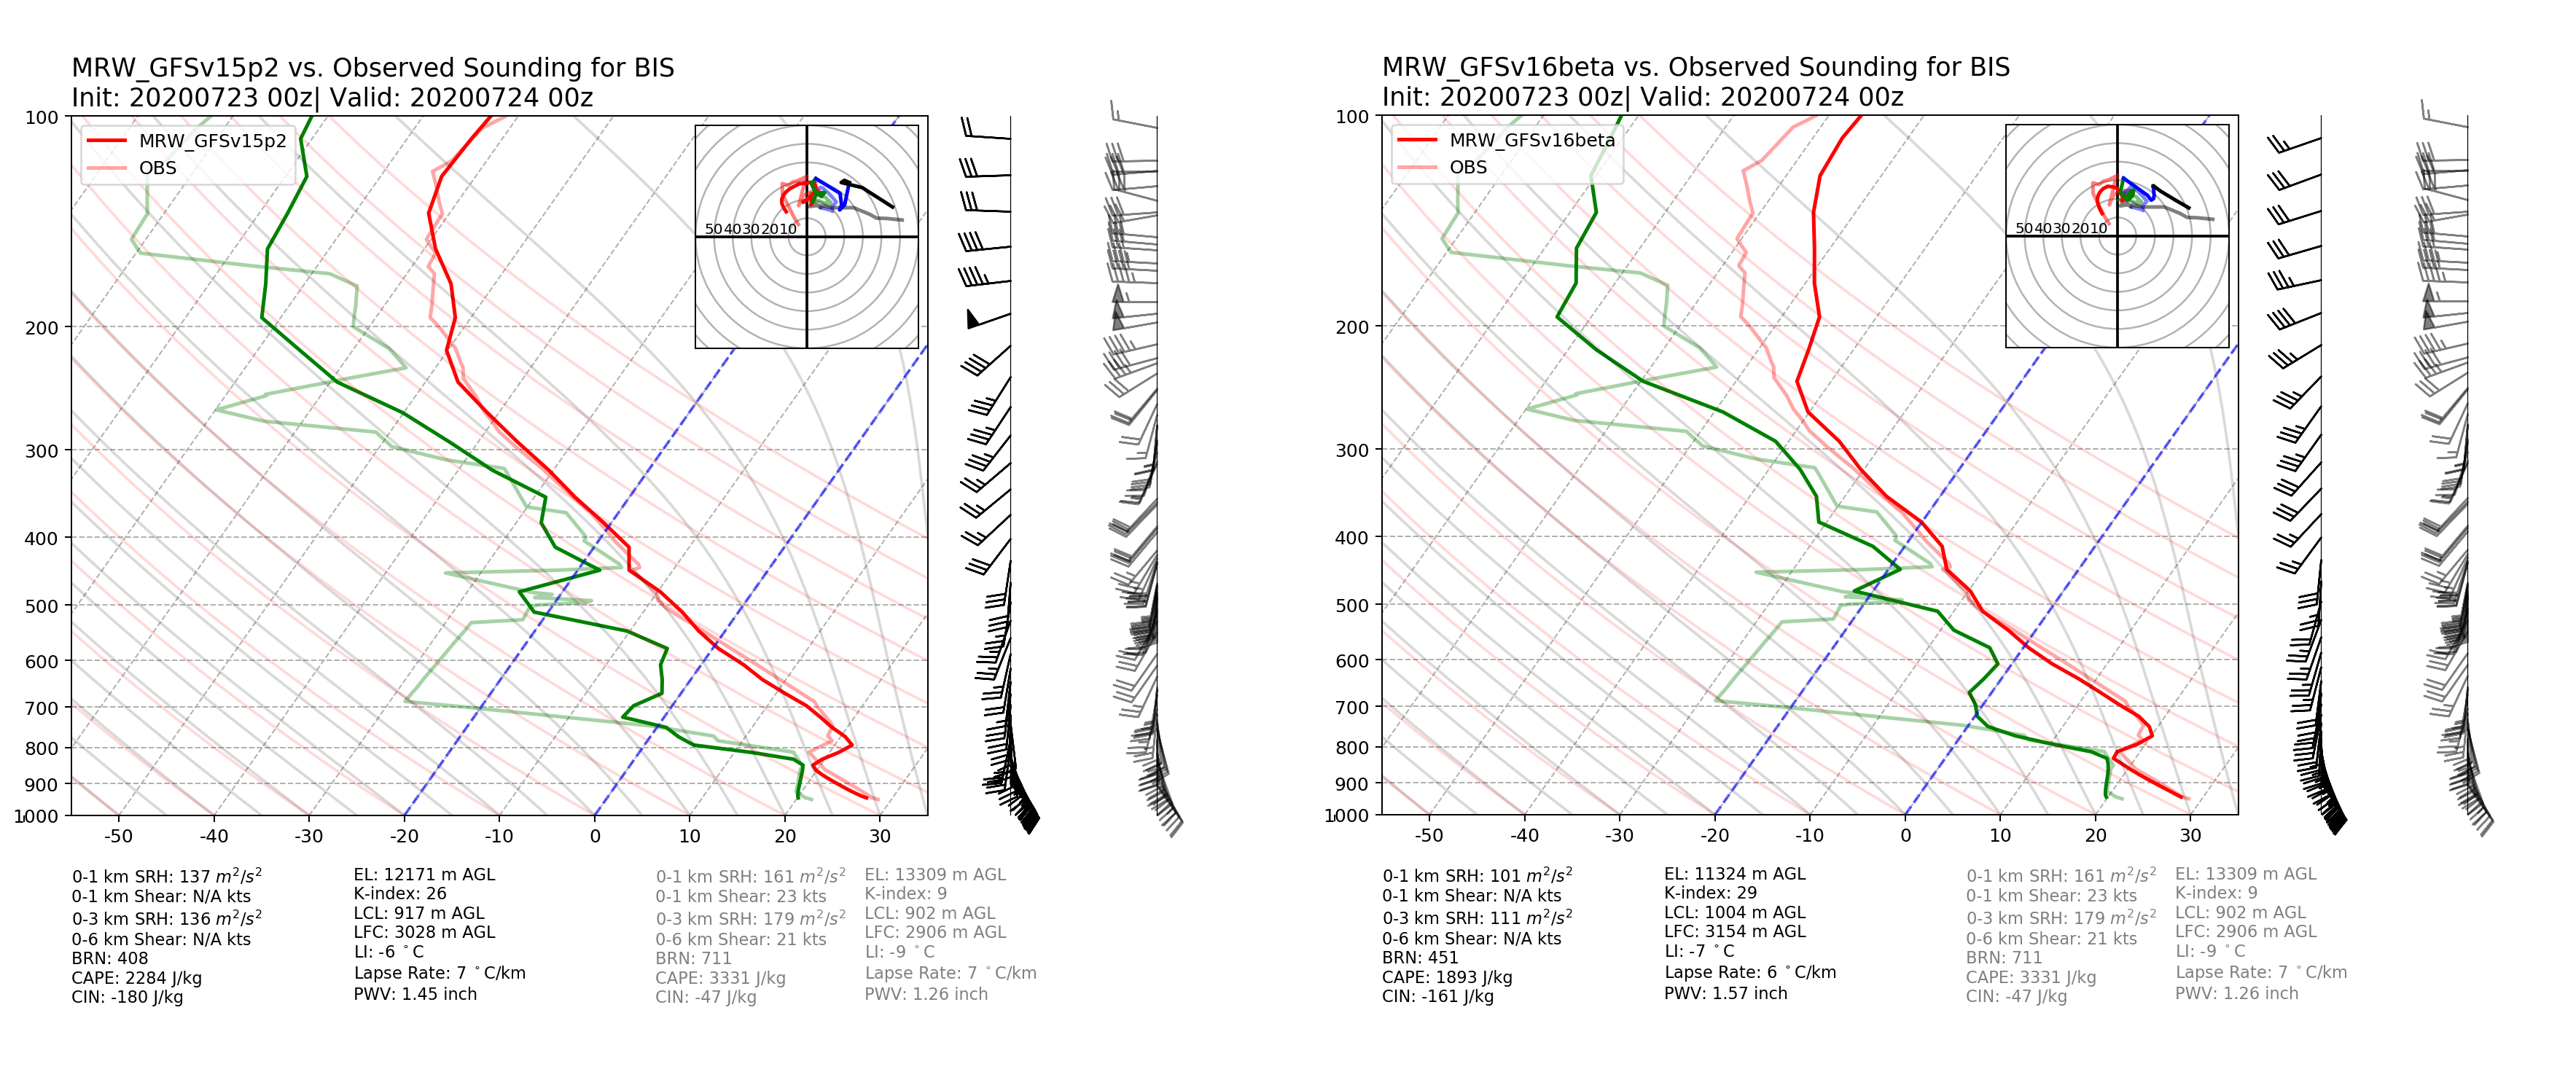
Simulated and observed sounding profile at the sounding site of Bismark (BIS), ND. CAPE values are listed at the bottom.
The CAPE simulated from MRW_GFSv15p2 and MRW_GFSv16beta at BIS are 2284 and 1893 J/kg, both smaller than the CAPE from observed sounding (3331 J/kg) at the BIS sounding site.
CAPE from RAP_ANL is larger than the observed CAPE computed from the sounding profile at the BIS sounding site.
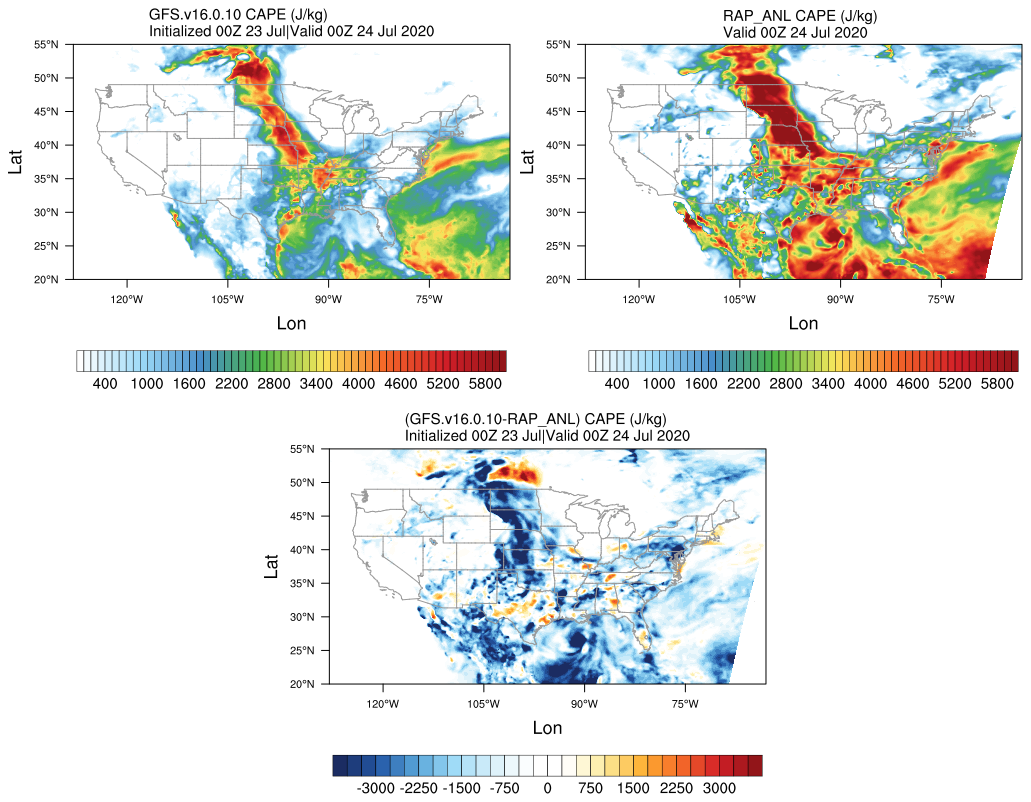
Spatial distribution of Convective Available Potential Energy (CAPE)
GFS.v16.0.10 simulates a lower value of CAPE compared with RAP_ANL.
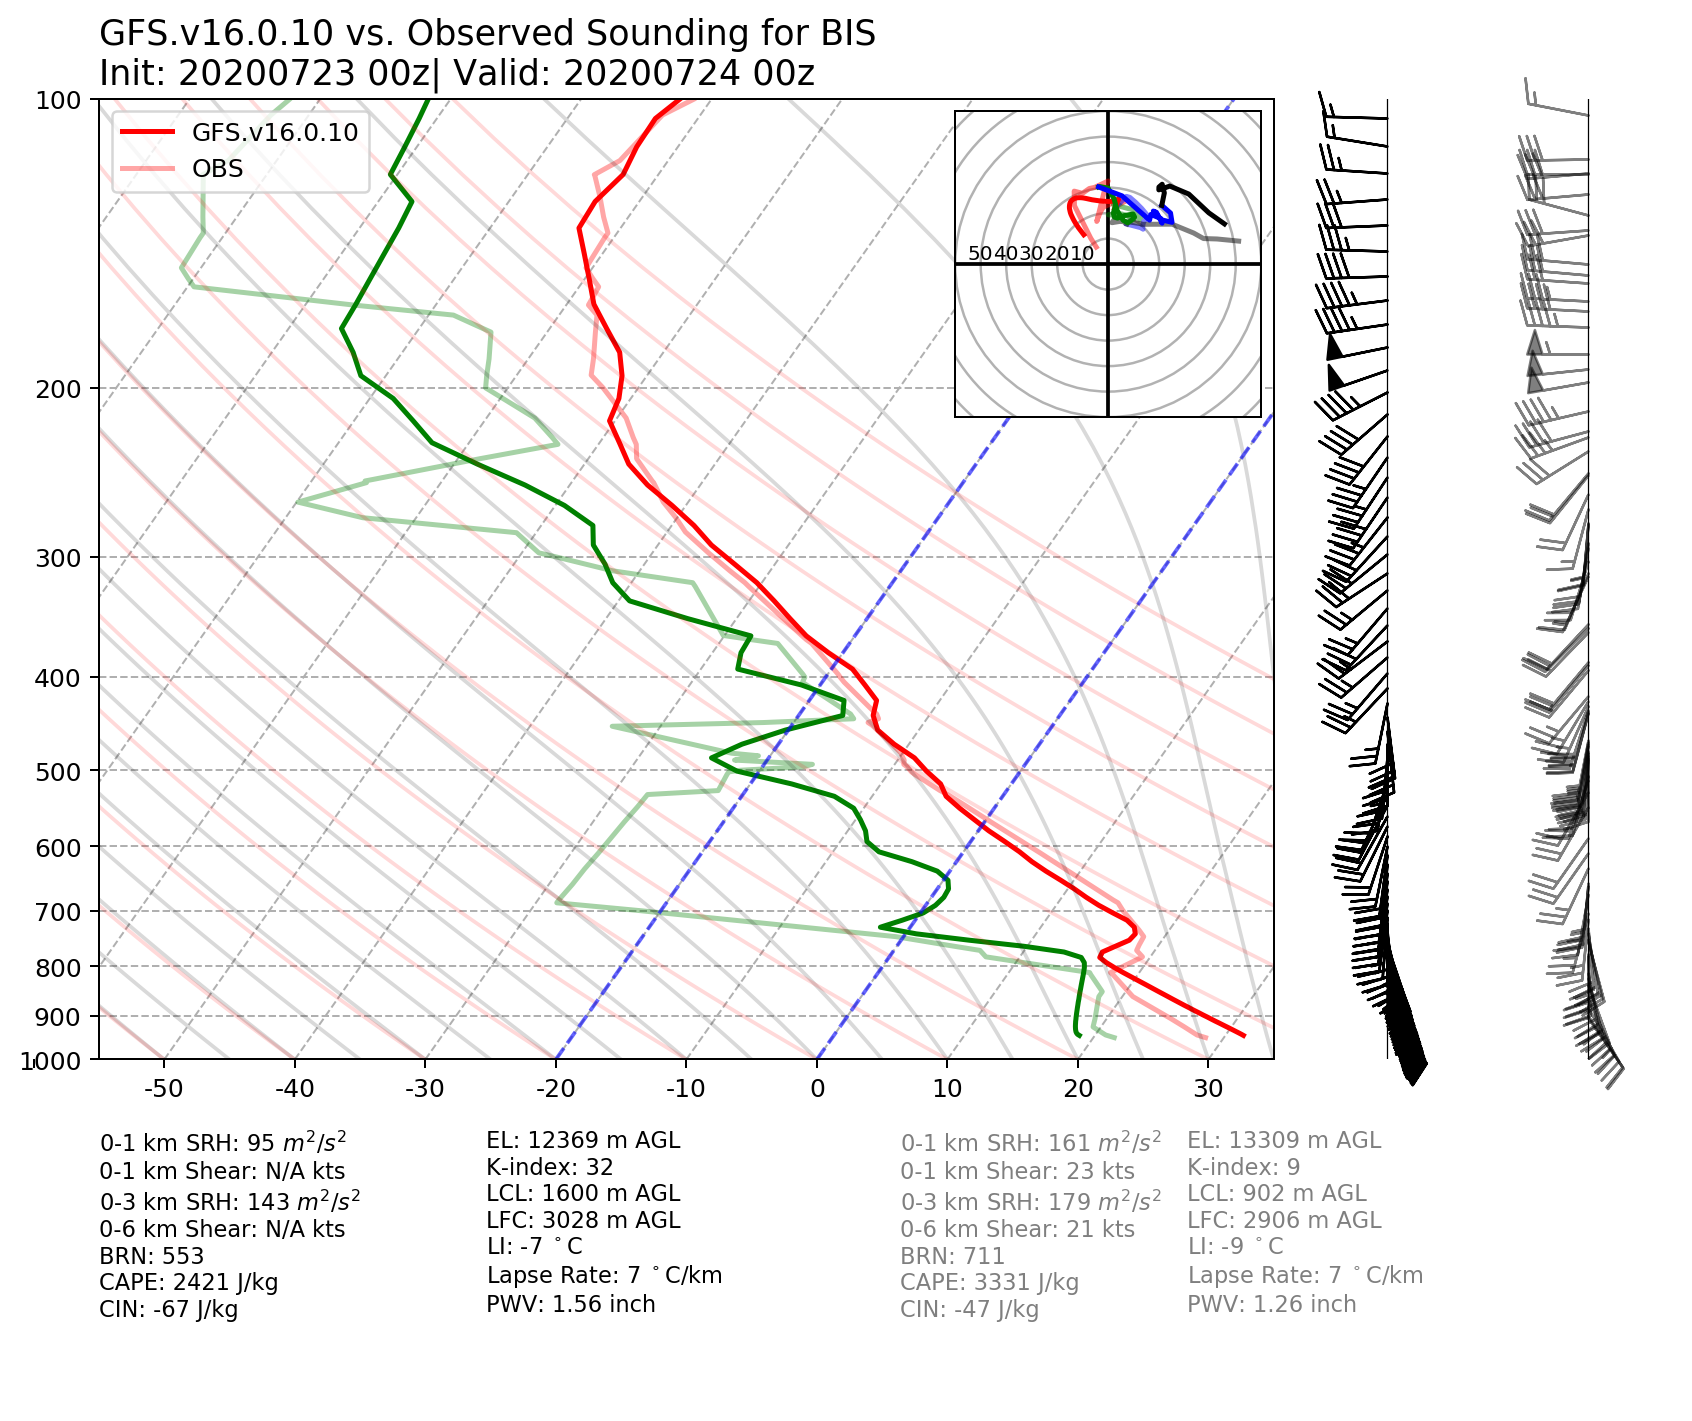
Simulated and observed sounding profile at the sounding site of Bismark (BIS), ND. CAPE values are listed at the bottom.
The CAPE simulated from GFS.v16.0.10 at BIS are 2421 J/kg, smaller than the CAPE from observed sounding (3331 J/kg) at the BIS sounding site.
GFS.v16.0.10 simulates a slightly larger CAPE than the two compsets of MRW_GFSv16beta and MRW_GFSv15p2 at the BIS sounding site.
11.3. Summary and Discussion
Both MRW App v1.0 and GFS.v16.0.10 simulate a lower value of CAPE compared with RAP_ANL and sounding observation in this summertime case study. Further investigations (MEG 2021) show that this is related to the drier soil layers in GFS initial conditions.
References
NOAA Environmental Modeling Center Model Evaluation Group (MEG) (2021). [Link]