Note
Click here to download the full example code
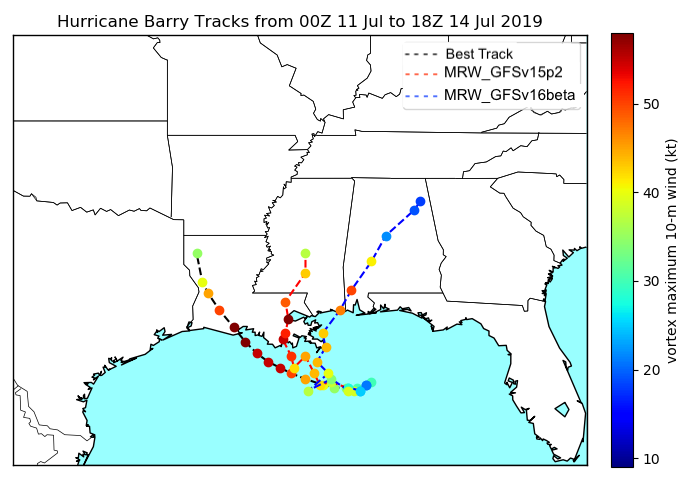
Plotting Hurricane Track and Intensity Map
This example plots the hurricane tracks and intensity estimated from tc-tracker as well as the BestTrack data.
from matplotlib import pyplot as plt
from mpl_toolkits.basemap import Basemap
import numpy as np
import matplotlib.cm as cm
import matplotlib.colors as co
import matplotlib

# Define map
m = Basemap(projection='cyl', \
        llcrnrlat= 25, urcrnrlat= 40, \
        llcrnrlon= -100, urcrnrlon= -80, \
        resolution='l')

# Define plot size
fig, ax = plt.subplots(figsize=(8,8))

# Read GFSv15p2 vortext tracker results
csv_file = "GFSv15p2/fort.69"
tc = np.recfromcsv(csv_file, unpack=True, names=['stormid', 'count', 'initdate', 'constant', 'atcf', 'leadtime', 'lat','lon','ws','mslp','placehoder', 'thresh', 'neq', 'blank1', 'blank2', 'blank3','blank4','blank5','blank6','blank7'], dtype=None)

# Read GFSv16beta vortext tracker results
csv_file2 = "16beta/fort.69"
tc2 = np.recfromcsv(csv_file2, unpack=True, names=['stormid', 'count', 'initdate', 'constant', 'atcf', 'leadtime', 'lat','lon','ws','mslp','placehoder', 'thresh', 'neq', 'blank1', 'blank2', 'blank3','blank4','blank5','blank6','blank7'], dtype=None)

# Read BestTrack data
bal_file ="BestTrack/bal022019_post.dat"
bal = np.recfromcsv(bal_file,unpack=True,delimiter=",",usecols=[0,2,6,7,8,9,10,11],names=['stormid','time','lat','lon','ws','mslp','intens','thresh'],dtype=None)

# Initialize blank lists
xs1 = []
ys1 = []
xs2 = []
ys2 = []

xs12 = []
ys12 = []
xs22 = []
ys22 = []

tclon =[]
tclat=[]
ws=[]
bxs1 = []
bys1 = []
ballon=[]
ballat=[]

# Prepare color map based on vortex center maximum wind speed
cmap=plt.cm.jet
norm=co.Normalize(vmin=9,vmax=55)
colors=plt.cm.ScalarMappable(norm,cmap)
col=colors.to_rgba(tc.ws)
bcol=colors.to_rgba(bal.ws)
col2=colors.to_rgba(tc2.ws)

# Read the vortex center, lat and lon, from BestTrack data
for k in range(len(bal.lat)):
    if bal.thresh[k] == 34 or bal.thresh[k] == 0:
        ballon=float(bal.lon[k][1:5])*0.1*(-1)
        ballat=float(bal.lat[k][1:4])*0.1
        lonn,latt=ballon,ballat
        xptt,yptt=m(lonn,latt)
        lonptt,latptt=m(xptt,yptt,inverse=True)
        bxs1.append(lonn)
        bys1.append(latt)
cs1=m.plot(bxs1, bys1, linestyle='--',color='Black',label='BestTrack')

# Read the vortex center, lat and lon, from BestTrack data to make colored dots along with the tracks
bxs1 = []
bys1 = []
ballon=[]
ballat=[]
count=0
for k in range(len(bal.lat)):
    if bal.thresh[k] == 34 or bal.thresh[k] == 0:
        ballon=float(bal.lon[k][1:5])*0.1*(-1)
        ballat=float(bal.lat[k][1:4])*0.1
        lonn,latt=ballon,ballat
        xptt,yptt=m(lonn,latt)
        lonptt,latptt=m(xptt,yptt,inverse=True)
        bxs1.append(lonn)
        bys1.append(latt)
        m.plot(bxs1[count], bys1[count], marker='o',color=bcol[k,:])
        count=count+1
encoding='utf-8'

# Read the vortex center, lat and lon, from tc-tracker results for GFSv15p2
for j in range(len(tc.ws)):
    tcstormid=str(tc.stormid[j],encoding)
    print(tcstormid)
    if tcstormid=='AL' and tc.count[j]== 2 and tc.thresh[j]==34 and tc.leadtime[j]<=9000:
        tclon=float(tc.lon[j][1:5])*0.1*(-1)
        tclat=float(tc.lat[j][1:4])*0.1
        lon, lat = tclon, tclat
        xpt, ypt = m(lon, lat)
        lonpt, latpt = m(xpt, ypt, inverse=True)
        xs1.append(lon)
        ys1.append(lat)
cs2=m.plot(xs1, ys1, linestyle='--',color='Red',label='UFSv1.0.0_15p2_hybedmf')

# Read the vortex center, lat and lon, from tc-tracker results for GFSv15p2 to make colored dots along with the tracks
xs1 = []
ys1 = []
xs2 = []
ys2 = []
tclon =[]
tclat=[]
count=0
for j in range(len(tc.ws)):
    tcstormid=str(tc.stormid[j],encoding)
    if tcstormid=='AL' and tc.count[j]==2 and tc.thresh[j]==34 and tc.leadtime[j]<=9000:
        tclon=float(tc.lon[j][1:5])*0.1*(-1)
        tclat=float(tc.lat[j][1:4])*0.1
        lon, lat = tclon, tclat
        xpt, ypt = m(lon, lat)
        lonpt, latpt = m(xpt, ypt, inverse=True)
        xs1.append(lon)
        ys1.append(lat)
        m.plot(xs1[count], ys1[count], marker='o',color=col[j,:])
        count=count+1
        print(count)

# Read the vortex center, lat and lon, from tc-tracker results for GFSv16beta
for j in range(len(tc2.ws)):
    tc2stormid=str(tc2.stormid[j],encoding)
    print(tc2stormid)
    if tc2stormid=='AL' and tc2.count[j]== 2 and tc2.thresh[j]==34 and tc2.leadtime[j]<=9000:
        tc2lon=float(tc2.lon[j][1:5])*0.1*(-1)
        tc2lat=float(tc2.lat[j][1:4])*0.1
        lon2, lat2 = tc2lon, tc2lat
        xpt2, ypt2 = m(lon2, lat2)
        lonpt2, latpt2 = m(xpt2, ypt2, inverse=True)
        xs12.append(lon2)
        ys12.append(lat2)
cs22=m.plot(xs12, ys12, linestyle='--',color='Blue',label='UFSv1.0.0_16beta')

# Read the vortex center, lat and lon, from tc-tracker results for GFSv16beta to make colored dots along with the tracks
xs12 = []
ys12 = []
xs22 = []
ys22 = []
tc2lon =[]
tc2lat=[]
count2=0
for j in range(len(tc2.ws)-1):
    tc2stormid=str(tc2.stormid[j],encoding)
    if tc2stormid=='AL' and tc2.count[j]==2 and tc2.thresh[j]==34 and tc2.leadtime[j]<=9000:
        tc2lon=float(tc2.lon[j][1:5])*0.1*(-1)
        tc2lat=float(tc2.lat[j][1:4])*0.1
        lon2, lat2 = tc2lon, tc2lat
        xpt2, ypt2 = m(lon2, lat2)
        lonpt2, latpt2 = m(xpt2, ypt2, inverse=True)
        xs12.append(lon2)
        ys12.append(lat2)
        m.plot(xs12[count2], ys12[count2], marker='o',color=col2[j,:])
        count2=count2+1

# Draw coastline
m.drawcoastlines()
m.drawcountries()
m.drawstates()
m.drawmapboundary(fill_color='#99ffff')
m.fillcontinents(color='white',lake_color='#99ffff')
colors.set_array([])

# Show and save the plot
plt.legend()
plt.title('Hurricane Barry Tracks from 00Z 11 Jul to 18Z 14 Jul 2019')
plt.colorbar(colors,fraction=0.035,pad=0.04,label='vortex maximum 10-m wind (kt)')
plt.show()
plt.savefig('Tracker_Barry_ufsv1.png')
Total running time of the script: ( 0 minutes 0.000 seconds)