3. 2019 Hurricane Barry
Hurricane Barry made landfall in Louisiana on July 11, 2019. The peak wind speed and minimum pressure reached 72 mph and 992 hPa, respectively during the storm.
3.1. Model Configuration and Datasets
The UFS Medium-Range Weather (MRW) Application (App) is used to prepare initial conditions, compile and run the UFS model, and post process the raw model outputs. Two model configuration compsets (GFSv15p2 and GFSv16beta) are tested using the C768 (~13km) spatial resolution with 64 vertical levels (default).
The case runs are initialized at 00z Jul 11, 2019 with 120 hours forecasting. The app uses ./xmlchange to change the runtime settings. The settings that need to be modified to set up the start date, start time, and run time are listed below.
./xmlchange RUN_STARTDATE=2019-07-01,START_TOD=0,STOP_OPTION=nhours,STOP_N=120
Initial condition (IC) files are created from GFS operational dataset in NEMSIO format. The Stand-alone Geophysical Fluid Dynamics Laboratory (GFDL) Vortex Tracker is a tool to estimate hurricane tracks and intensities. The Best Track dataset provides the ‘truth’ data for hurricane evolution.
The GFS model EMC global workflow points to the most up-to-date GFS model development code. The GFS.v16.0.10 is tested in C768 (~13km) resolution and in 128 vertical levels. It uses two scripts, setup_expt_fcstonly.py and setup_workflow_fcstonly.py to set up the mode simulation date and case directories.
The case runs are initialized at 00z Jul 11, 2019 with 120 hours forecasting. The settings that need to be modified to set up the start date and directories are listed below.
./setup_expt_fcstonly.py --pslot Barry --configdir /PATH/TO/YOUR/GLOBAL/WORKFLOW/parm/config --idate 2019071100 --edate 2019071100 --res 768 --comrot /PATH/TO/YOUR/EXP/DIR/comrot --expdir /PATH/TO/YOUR/EXP/OUTPUT/expdir
The account and simulation duration time can be set up in /expdir/Barry/config.base file.
./setup_workflow_fcstonly.py --expdir /PATH/TO/YOUR/OUTPUT/expdir/Barry
Next step is to go to /expdir/Barry to submit the run by
crontab Barry.crontab
3.2. Case Results
3.2.1. Hurricane Track and Intensity
Hurricane tracks from MRW_GFSv16beta (blue line), MRW_GFSv15p2 (red line), and Best Track (black line). The dots are color coded with the vortex maximum 10-m wind speed (WS, kt).
Both MRW_GFSv16beta and MRW_GFSv15p2 generate right-of-track biases.
Hurricane track and intensity simulated by MRW_GFSv15p2 are closer to Best Track compared with MRW_GFSv16beta.
Time series of the vortex maximum surface wind speed (WS, left panel) and minimum mean sea level pressure (MSLP, right panel)
The peak wind speed at the vortex center in MRW_GFSv15p2 (60 kts) is closer to Best Track (67 kts) compared with MRW_GFSv16beta (50 kts).
Both two physics compsets simulate the minimum sea level pressure relatively well.
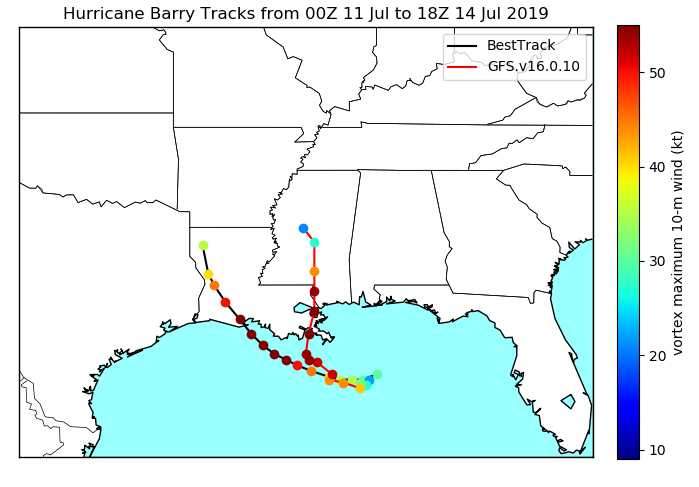
Hurricane tracks from GFS.v16.0.10 (red line) and Best Track (black line). The dots are color coded with the vortex maximum 10-m wind speed (WS, kt).
GFS.v16.0.10 generates right-of-track bias.
Time series of the vortex maximum surface wind speed (WS, left panel) and minimum mean sea level pressure (MSLP, right panel)
The time variation of maximum wind speed in GFS.v16.0.10 agrees well with Best Track.
The minimum sea level pressure reaches to a lower value in GFS.v16.0.10 (982 hPa) compared with Best Track (993 hPa).
3.2.2. Comparison with Satellite Data
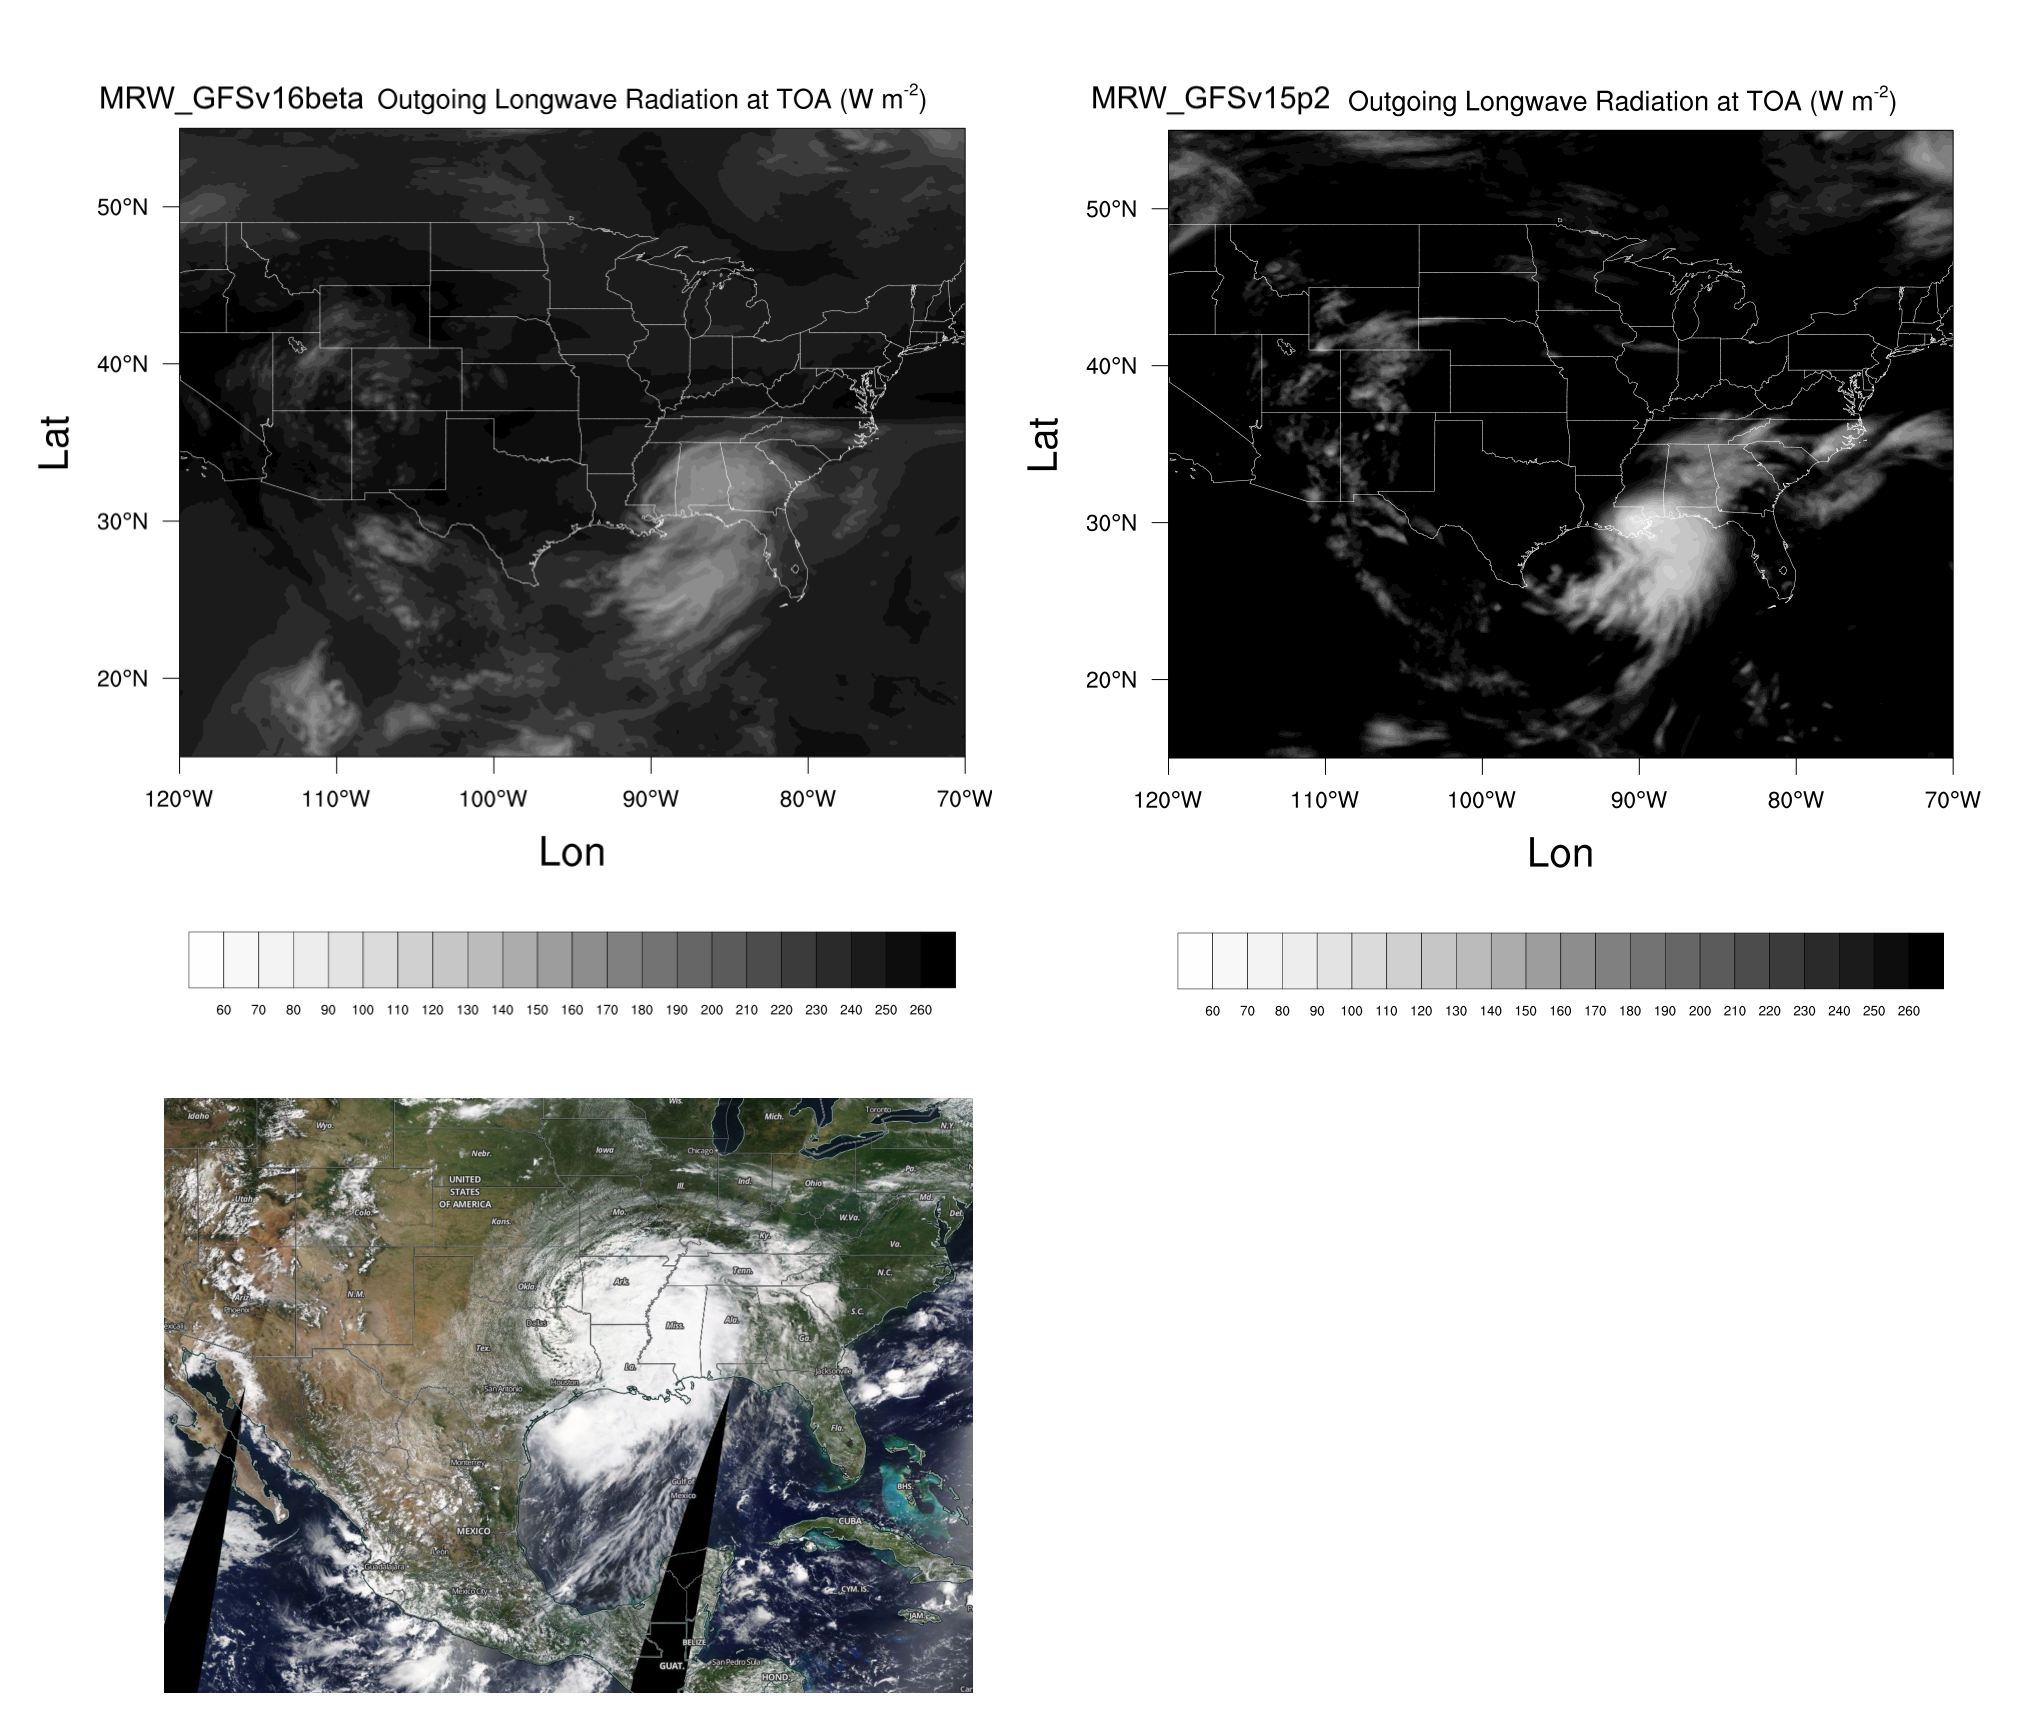
Simulated outgoing longwave radiation (OLR) at the top of atmosphere (TOA) from MRW_GFSv16beta and MRW_GFSv15p2, and infrared images from NASA Worldview at the forecast hour of 72.
Comparison with satellite product also indicates a right-of-track error
Lower OLR near the tropical cyclone (TC) center suggests more clouds in MRW_GFSv15p2 than in MRW_GFSv16beta
3.2.3. Hovmöller diagram of 850 hPa WS after Landfall
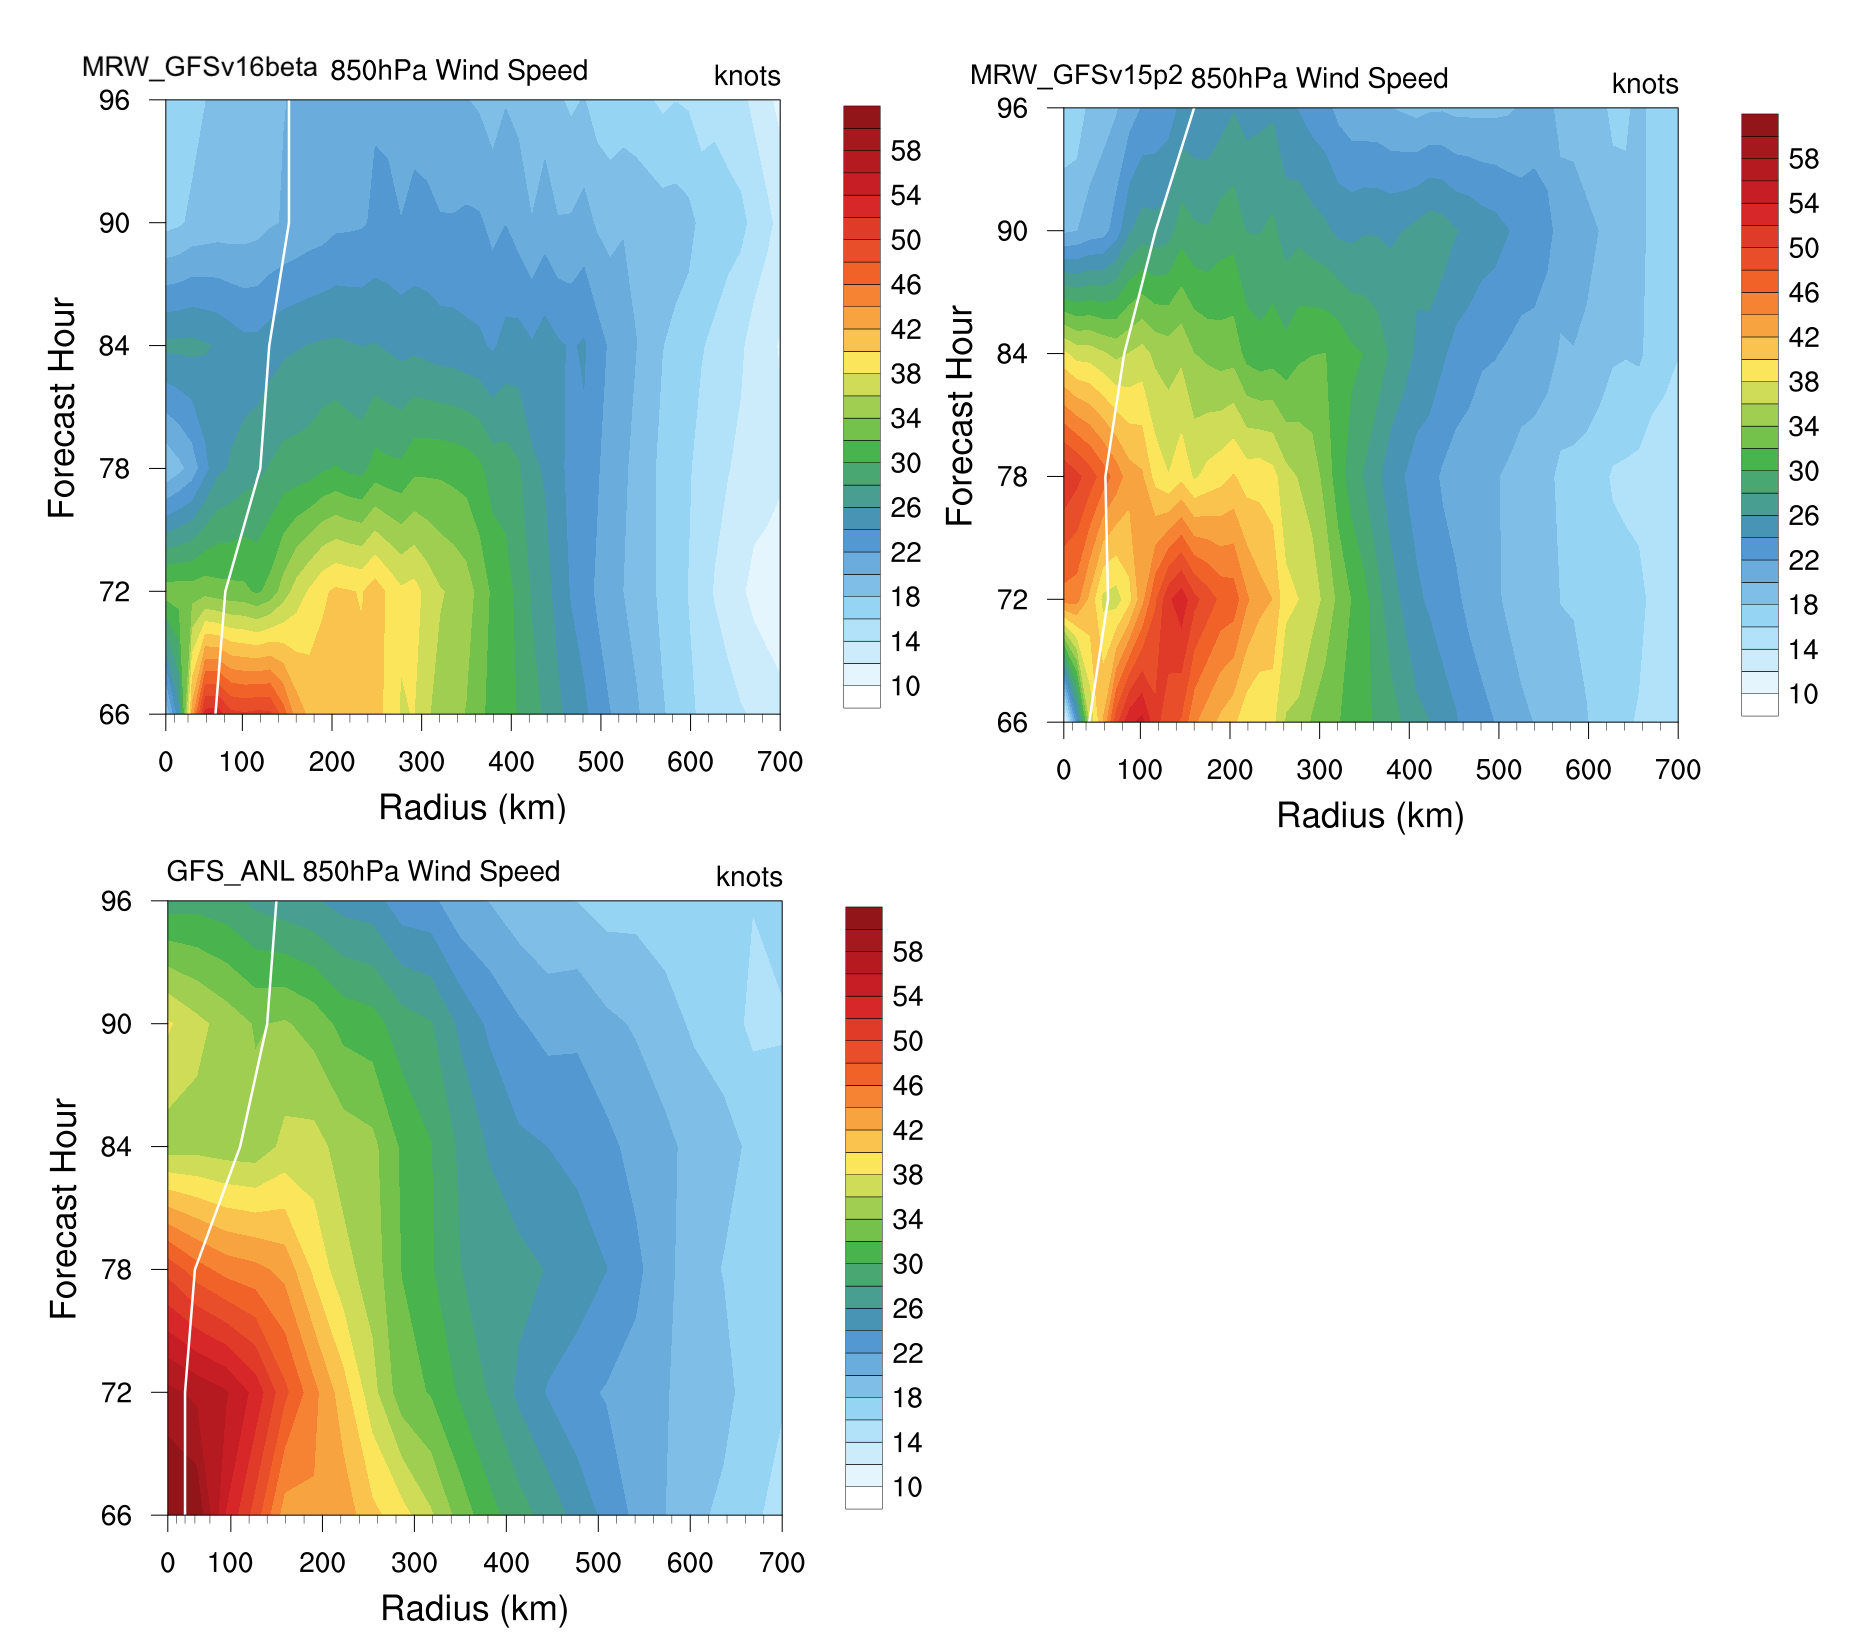
Hovmöller diagram of wind speed and 850 hPa and the radius of maximum wind (RMW, white line) after landfall
The low-level wind speed in GFS model is smaller than GFS_ANL.
The MRW_GFSv16beta has the largest inner core size. MRW_GFS15p2 has similar inner core sizes and GFS_ANL.
Hurricane intensity attenuates faster in the model compared with Best Track after landfall.
3.3. Summary and Discussion
The exacerbated right-of-track bias exists in both GFS.v16.0.10 and MRW_GFSv16beta compared with GFSv15p2. The right-of-track bias is likely associated with overactive convection and vortex tilt. This tends to induce convergence towards that excessive convection and leads to track bias (Lybarger et al. 2020).
References
Lybarger N. D., Kalina E., and Newman K. (2020). Diagnosing Hurricane Track Errors in the UFS Short-Range Weather Application (SRW). The First UFS Users’ Workshop, July 27-29, 2020. [Link]