8. 2020 January Cold Blast
The GFS model generates cold bias during this extreme temperature case. The arctic blast brought cold air to Iowa, Minnesota, and Wisconsin on Jan 20, 2020.
8.1. Model Configuration and Datasets
The case runs are initialized at 12z Jan 17, 2020 with 120 hours forecasting. The corresponding namelist options that need to be changed are listed below. The app uses ./xmlchange to change the runtime settings. The settings that need to be modified to set up the start date, start time, and run time are listed below.
./xmlchange RUN_STARTDATE=2020-01-17,START_TOD=43200,STOP_OPTION=nhours,STOP_N=120
Initial condition (IC) files are created from GFS operational dataset in NEMSIO format. The GFS reanalysis dataset are used as ‘truth’ to compare with simulation results.
The GFS model EMC global workflow points to the most up-to-date GFS model development code. The GFS.v16.0.10 is tested in C768 (~13km) resolution and in 128 vertical levels. It uses two scripts, setup_expt_fcstonly.py and setup_workflow_fcstonly.py to set up the mode simulation date and case directories.
The case runs are initialized at 12z Jan 17, 2020 with 120 hours forecasting. The settings that need to be modified to set up the start date and directories are listed below.
./setup_expt_fcstonly.py --pslot 2020ColdBias --configdir /PATH/TO/YOUR/GLOBAL/WORKFLOW/parm/config --idate 2020011712 --edate 2020011712 --res 768 --comrot /PATH/TO/YOUR/EXP/DIR/comrot --expdir /PATH/TO/YOUR/EXP/OUTPUT/expdir
The account and simulation duration time can be set up in /expdir/2020ColdBias/config.base file.
./setup_workflow_fcstonly.py --expdir /PATH/TO/YOUR/OUTPUT/expdir/2020ColdBias
Next step is to go to /expdir/2020ColdBias to submit the run by
crontab 2020ColdBias.crontab
8.2. Case Results
8.2.1. Synoptic Dynamics
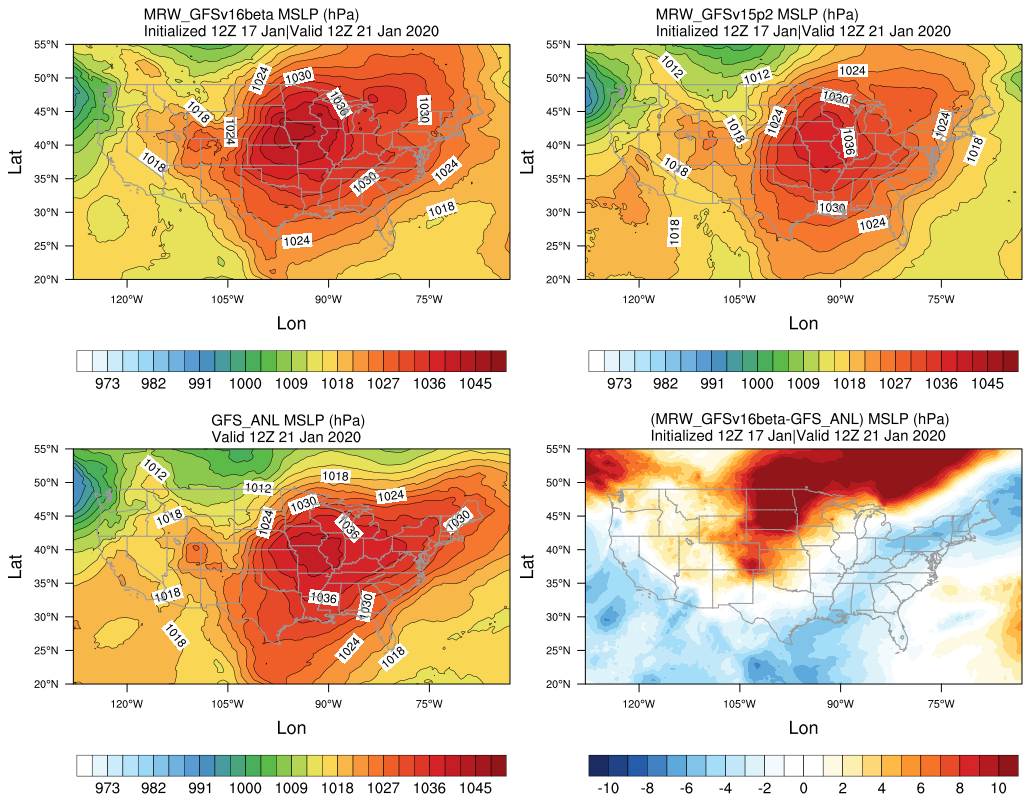
Mean sea level pressure (hPa)
Positive bias of sea level pressure in Midwestern U.S. and Southern Ontario exist in both MRW_GFSv15p2 and MRW_GFSv16beta simulations, featuring with clearer skies.
The surface flow pattern over Midwestern U.S is from northwest in the model, which leads more cold air from Canada compared with GFS_ANL.
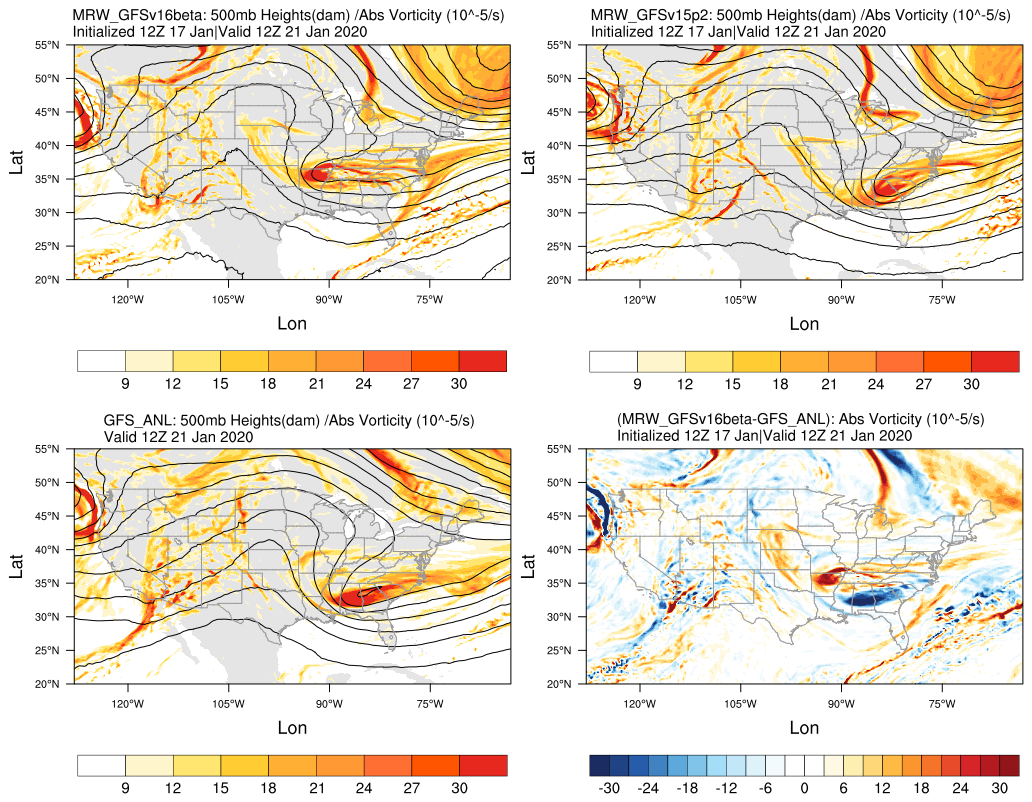
500 hPa geopotential heights (dam) and absolute vorticity (10 -5/s)
Both two physics compsets simulate a positive trough over Ontario, which usually generates the least amount of severe weather.
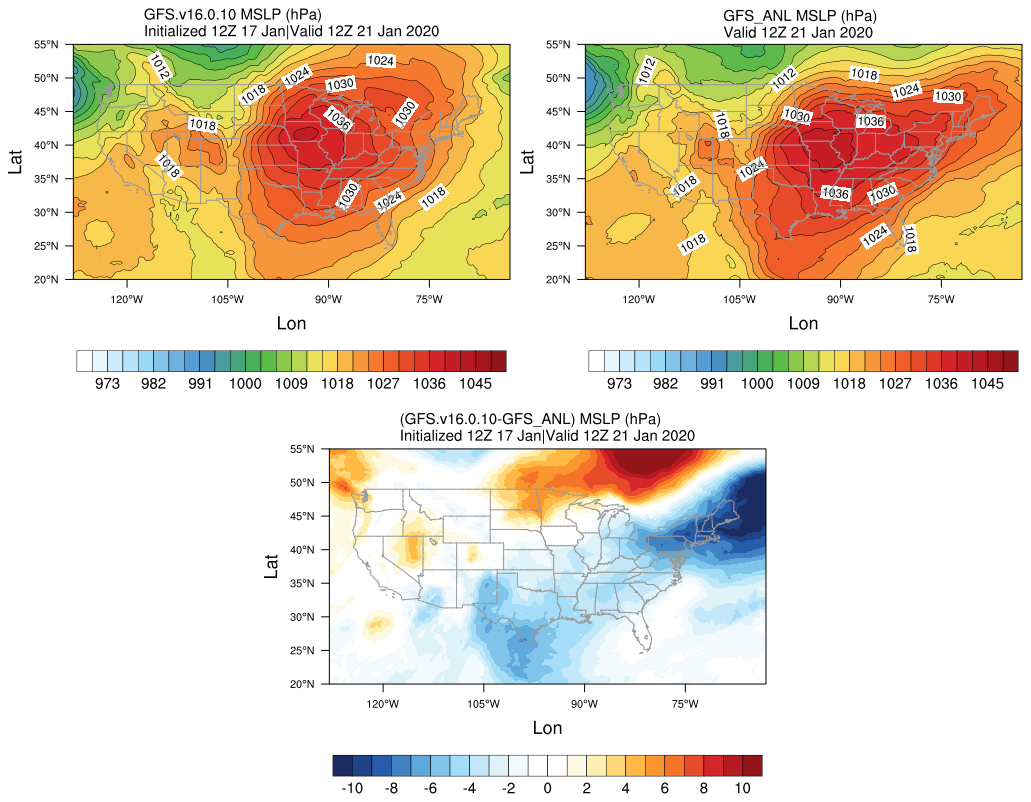
Mean sea level pressure (hPa)
GFS.v16.0.10 simulates higher sea level pressure and weaker pressure gradient over Ontario, and lower sea level pressure over the Northeast.
The surface flow pattern over Midwestern U.S is from northwest in the model, which leads more cold air from Canada compared with GFS_ANL.
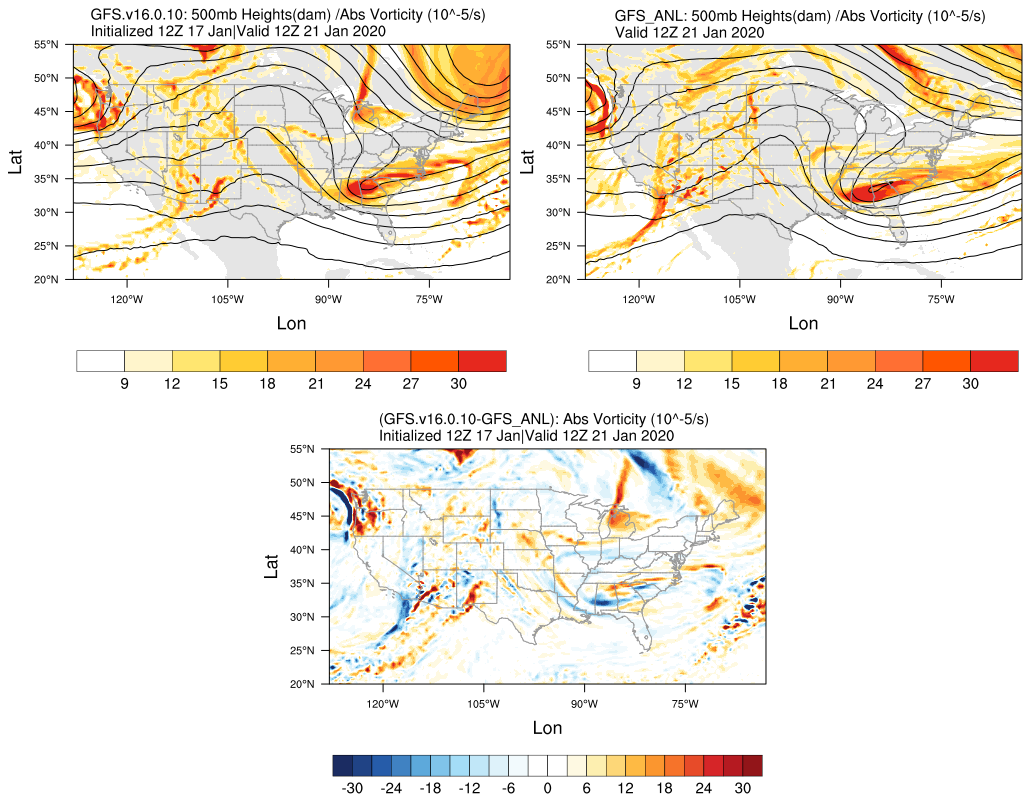
500 hPa geopotential heights (dam) and absolute vorticity (10 -5/s)
A positive tilted trough is located at Ontario in GFS.v16.0.10, while not in GFS_ANL
8.2.2. Surface Temperature and Wind Speed
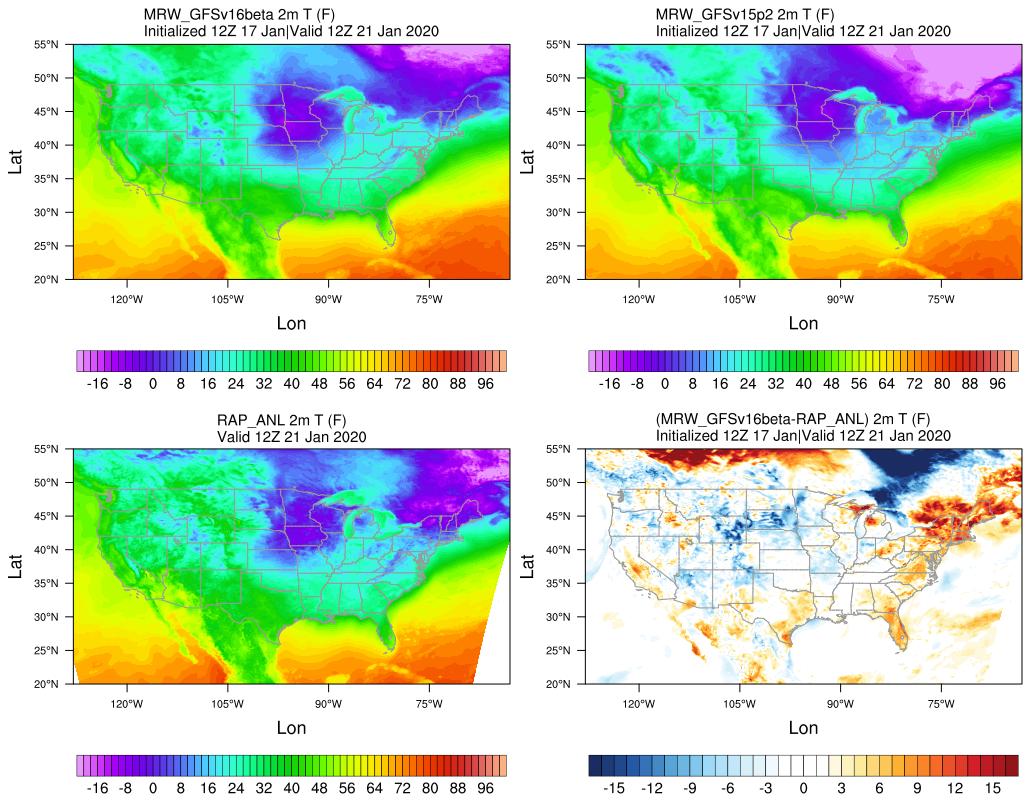
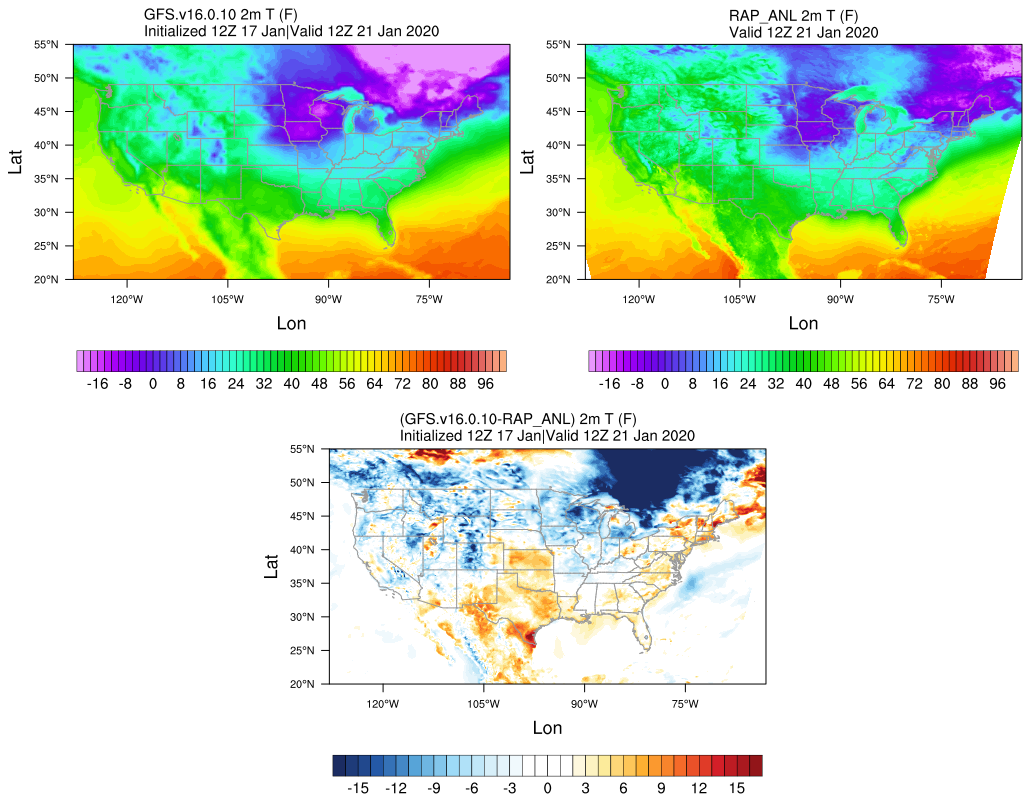
2-m temperature (F)
MRW_GFSv16beta and MRW_GFSv15p2 generates a cold bias over central U.S. and Ontario during this Arctic cold blast event.
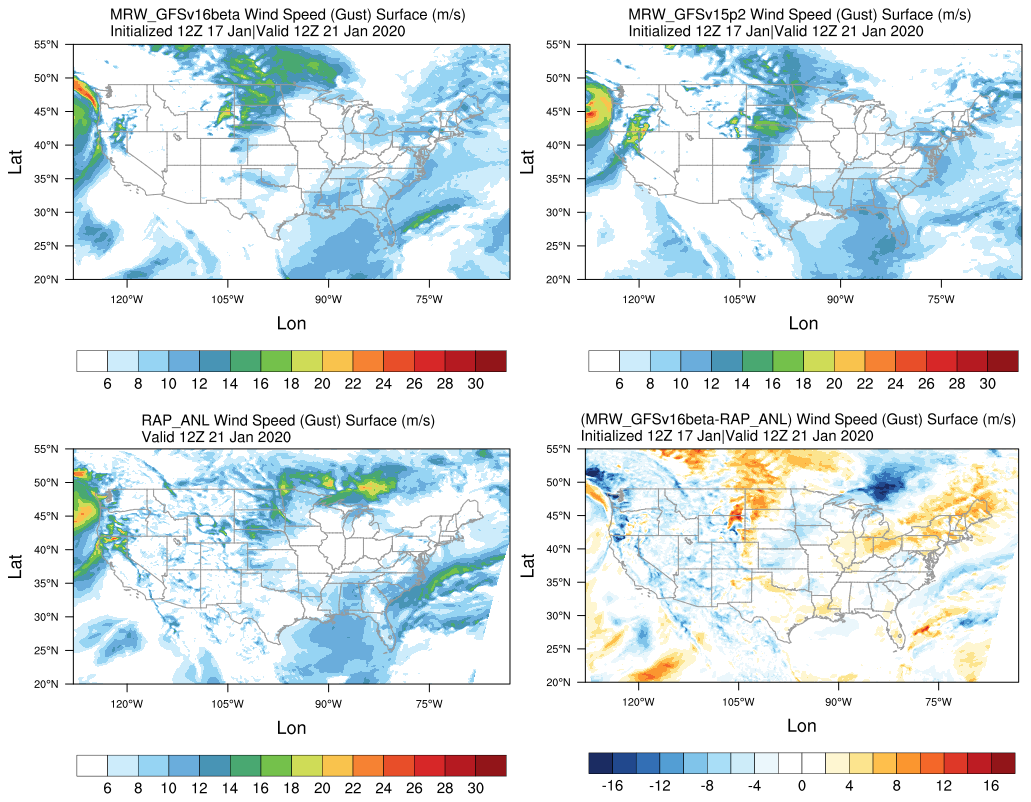
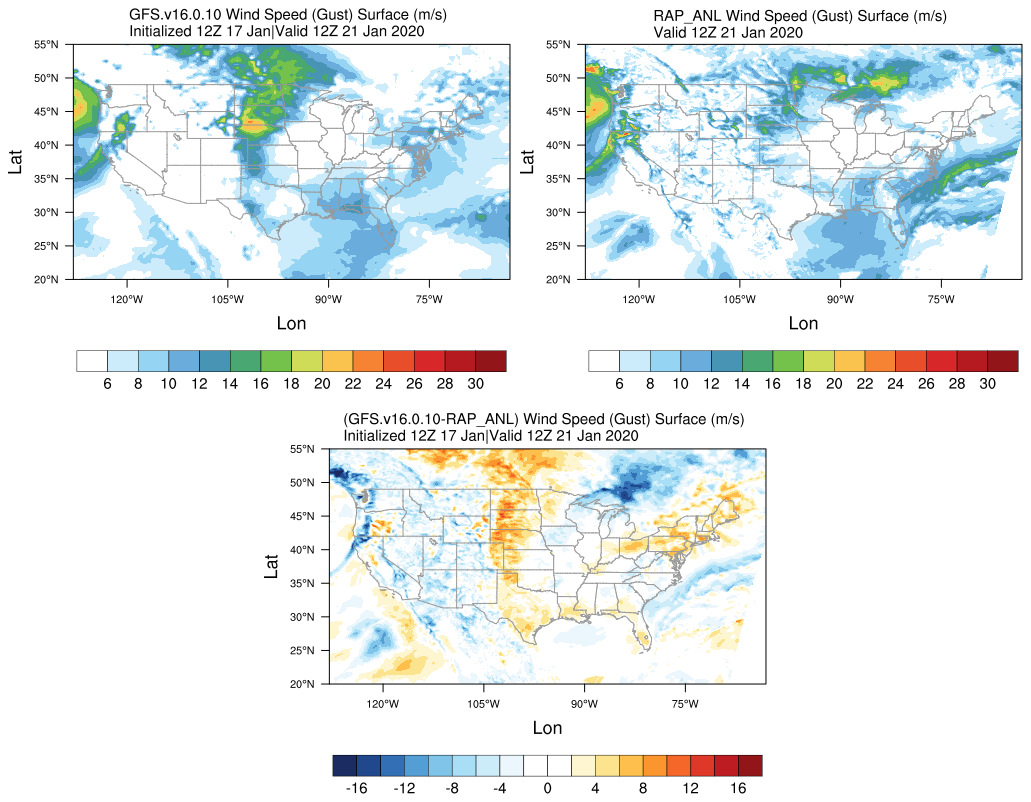
Surface gust (m/s)
The surface wind gust over Ontario is not simulated well in the model, which is related to the higher simulated surface pressure and weaker pressure gradient at this region.
8.3. Summary and Discussion
The GFS model generates consistent cold biases from the three model versions (MRW_GFSv15p2, MRW_GFSv16beta, and GFS.v16.0.10) during this extreme temperature event in the winter season.