Note
Click here to download the full example code
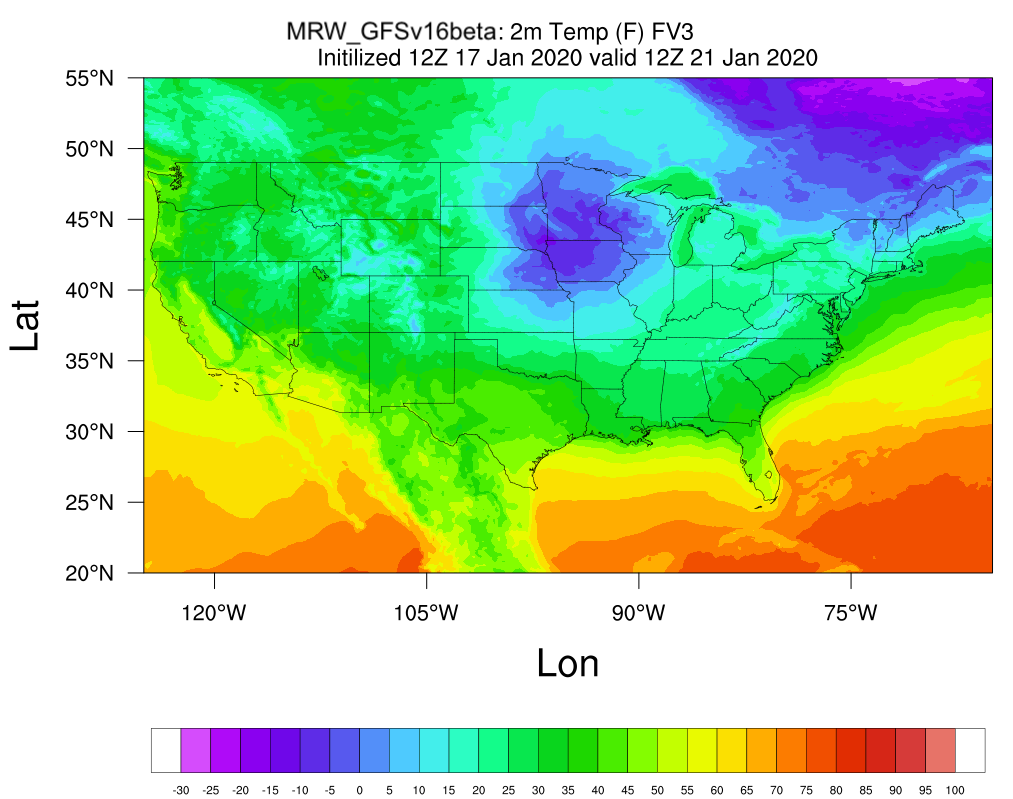
Plotting Spatial Map of 2-m Temperature
This example plots the spatial distribution of 2-m temperature from UFS MRW outputs.
# Purpose: plot spatial map of 2-m temperature field from UFS Medium-Range Weather App model run outputs.
# Usage: python Spatial_2m_T.py
# Author: Xia Sun, xia.sun@noaa.gov, Oct 15, 2020

import Ngl, Nio
import pandas as pd
import numpy as np
import xarray as xr
import netCDF4 as nc
from netCDF4 import Dataset
import matplotlib.pyplot as plt

# Read in NetCDF data
fv3=nc.MFDataset('GFSv16veta/GFSPRS.GrbF96.nc')
tmp2m=fv3["TMP_2maboveground"][0,:,:]
tmp2mF=(tmp2m-273.15)*9/5+32
lat=fv3["latitude"]
lon=fv3["longitude"]

# Read in NetCDF data
wks_type = "png"
wks = Ngl.open_wks(wks_type,"FV3_T2_20200121_1200_MRW_GFSv16beta")
cnres                 = Ngl.Resources()

# Contour resources
cnres.cnFillOn        = True
cnres.cnFillPalette   = "NCV_bright_white"
cnres.cnLinesOn       = False
cnres.cnLineLabelsOn  = False
cnres.cnLevelSelectionMode = "ManualLevels"
cnres.cnMinLevelValF = -30
cnres.cnMaxLevelValF = 100
cnres.nglMaximize = True
cnres.tiXAxisString = "Lon"
cnres.tiYAxisString = "Lat"
cnres.lbOrientation   = "horizontal"

# Scalar field resources
cnres.sfXArray        = lon[:]
cnres.sfYArray        = lat[:]

# Map resources
cnres.mpFillOn               = False
cnres.mpGridAndLimbOn = False
cnres.mpLandFillColor        = "Transparent"
cnres.mpOceanFillColor       = "Transparent"
cnres.mpInlandWaterFillColor = "Transparent"
cnres.mpLimitMode        = "LatLon"

# Map region
cnres.mpMaxLonF = -65
cnres.mpMaxLatF = 55
cnres.mpMinLonF = -125
cnres.mpMinLatF = 20
cnres.mpDataBaseVersion     = "MediumRes"
cnres.mpOutlineBoundarySets = "USStates"

# Plot resources
cnres0=cnres
cnres0.tiMainString = "MRW_GFSv16beta: 2m Temp (F) FV3 ~C~Initialized 12Z 17 Jan 2020 valid 12Z 21 Jan 2020"#"{} ({}) at {:.2f} hPa with fast_sat".format(clwmr.long_name,clwmr.units,vpfull)
cnres0.tiMainFontHeightF=0.012
contour = Ngl.contour_map(wks,tmp2mF[:,:],cnres0)

# Draw the plot
Ngl.draw(contour)
Ngl.end()